Precision Trading With Stevenson Price and Time Targets
by John R. Stevenson (Author)
Stevenson PTT
I'll be adding more charts onto this post (and perhaps other content modifications) over the weekend, so check back if you're interested in this topic.
I recently read the manual Precision Trading with Stevenson Price and Time Targets, and found it interesting enough to want to summarize it here. The concepts presented deal with cycle analysis, which is often overlooked in technical trading, but is just as important next to price and volume. I'm going to try and make this as simple and straightforward as possible.
First of all, the concept of cycles is fractal, in that within large cycles there are smaller cycles, and within smaller cycles there are yet even smaller cycles. Fortunately for the purpose of trading we don't necessarily need to worry ourselves with the overly large or small cycles behaving within price. We don't want to get caught up in the minutia of the 1-minute price cycles (unless we're a manic scalping robot) and, unless you're an "investor" large dominant cycles aren't going to help you trade intra-day.
So, as presented in the book by John R. Stevenson, here's how he explains it:
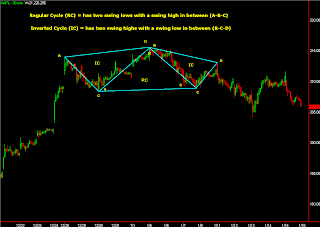
There are two cycles; a Regular Cycle (RC) and an Inverted Cycle (IC).
Each of these two cycles can have three variations: a Regular Cycle is either in an Up, Down, or Sideways trend. The same goes for an Inverted Cycle (can be up, down, or flat), like this:
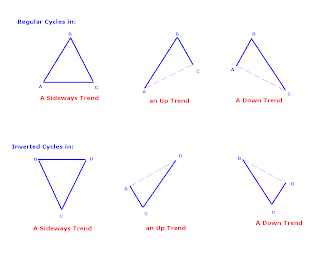 The characteristics of a RC are that it will have two swing lows with a swing high in between (think of a pyramid, bell-shape, or upside down "U"). The characteristics of a RC are that it will have two swing lows with a swing high in between (think of a pyramid, bell-shape, or upside down "U").
While an IC will have two swing highs with a swing low in between (think of an upside down pyramid or a "U" shape), like this:
 (note that the above illustration is very similar to the Gartley Pattern) (note that the above illustration is very similar to the Gartley Pattern)
Some key concepts include:
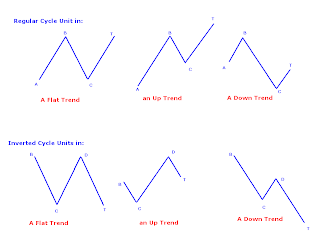
- An Inverted Cycle always follows a Regular Cycle, a Regular Cycle always follows an Inverted Cycle, and because of this they can be examined in terms of "units" (see the illustrations that follow).
- The IC & RC are expected to be relatively the same length of bars.
- Stevenson mentions that the technique he introduces (I'm getting to it) can be used on cycles as small as 3-bars (5-min chart), but explains that a minimum of 8-10 bars produces better results.
- It is not important for swing highs/lows be in the exact middle of an RC/IC.
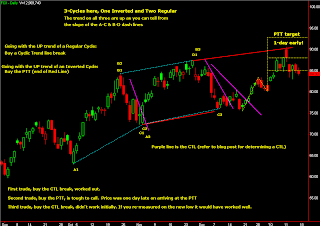
Being that an Inverted Cycle follows a Regular Cycle (and vice versa) they are considered a unit. Seen in the diagrams below, a RC (A-B-C) is followed by an IC (B-C-T) in their respective units, and an IC (B-C-D) is followed by it's paired RC (C-D-T).
 So, there are two concepts J.R. Stevenson lays out in his manual for making, what he refers to as, Price and Time Targets (PTT). So, there are two concepts J.R. Stevenson lays out in his manual for making, what he refers to as, Price and Time Targets (PTT).
Concept #1:
-If your observation tells you that you're in a Regular Cycle you will label the most recent swing low with a "C", the previous swing high a "B" and the swing low prior to that an "A".
- Once you have identified and labeled the RC, draw a line connecting points A and C, clone this line, then project off of A to arrive at a PTT. Like so: 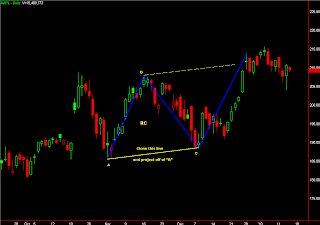 A couple of things to mention at this point. I'm not benefiting financially in any way for this blog post, so I'm not going to cherry-pick the examples. The example above did not meet the Price and Time Target, but it did come close, and there is information to be gained from price not reaching it's particular PTT. A couple of things to mention at this point. I'm not benefiting financially in any way for this blog post, so I'm not going to cherry-pick the examples. The example above did not meet the Price and Time Target, but it did come close, and there is information to be gained from price not reaching it's particular PTT.
Also, ALWAYS USE STOPS! This is not an all-inclusive trading strategy. It's simply a guide to help you be on the right side of a trade by going with the dominant cycle in the market. As such, you should rely on price patterns for entries based on your cycle analysis, not the other way around.
So, that's the basic premise behind making PTT's. You identify the cycle, draw a line between the swing lows (if it's a Regular Cycle) and project off the swing high (or low if working with an IC) to arrive at a target for price in time.
The second Concept in this manual is referred to as a Cyclic Trend Line (CTL). It is used to help identify when one cycle has ended and another has begun. In keeping with the above chart with a Regular Cycle as an example we produce a CTL as follows:
- Draw a line through the price bars of the B-C line, connecting the highs to the lows.
- Clone this parallel line and shift it outwards, so that it touches only one price bar point. This is your CTL! When price closes outside of this parallel line, the cycle is considered ended.
Here's the same chart as before, only this time adding the CTL: 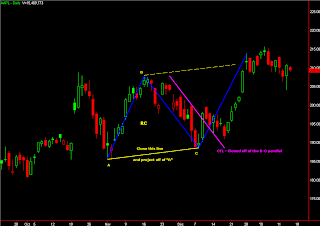 So, we can see that price closed outside of the CTL, ending the Regular Cycle. That wouldn't necessarily be a trigger for entry. We would want to look for a price pattern to emerge to take action. In this example we got a retest of the CTL with a steep (78.6%) retracement (or "Phoenix", whatever you want to call it), so we would look to buy a breakout from that retracement. So, we can see that price closed outside of the CTL, ending the Regular Cycle. That wouldn't necessarily be a trigger for entry. We would want to look for a price pattern to emerge to take action. In this example we got a retest of the CTL with a steep (78.6%) retracement (or "Phoenix", whatever you want to call it), so we would look to buy a breakout from that retracement.
One word of advice regarding the CTL; though it can be used on small cycles, more accurate results can be obtained by using it on cycle lengths of 10-bars or more.
OK, now time for some charts.
I pulled up a daily chart of FCX and there was a really straightforward Inverted Cycle that jumped out at me right away. So, included in the chart below are an Inverted Cycle, followed by a Regular Cycle (which comprises an Inverted Cycle Unit). The red lines represent the Price Time Targets: 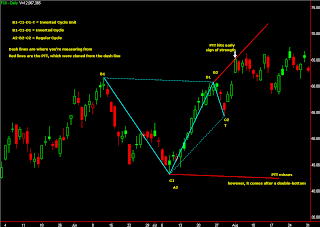 Seems simple enough, right? Well, here's where my brain starts to itch. Following this move in FCX price begins an upward consolidation cycle throughout much of August. All of a sudden we have these small (3-6 bars) RC/IC's, which produce targets that, though mostly hit, aren't very profitable on this time frame. So, it may be best to avoid this stock for the time being, or drill down into a smaller time frame to time entries/exits. Seems simple enough, right? Well, here's where my brain starts to itch. Following this move in FCX price begins an upward consolidation cycle throughout much of August. All of a sudden we have these small (3-6 bars) RC/IC's, which produce targets that, though mostly hit, aren't very profitable on this time frame. So, it may be best to avoid this stock for the time being, or drill down into a smaller time frame to time entries/exits.
Overlooking the smaller cycles on this Daily chart, we give the stock some time to for investors/traders to determine whether they like price higher or lower from here, and in so doing we allow the predominant cycle to work itself out. Here's what things look like:
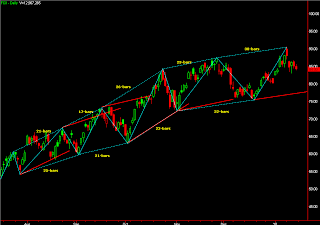
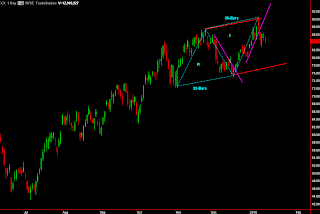
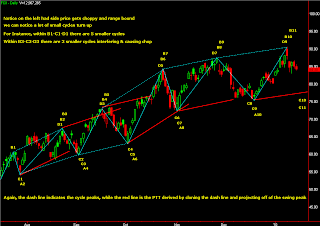 One more thing worth mentioning, if I haven't already; Regular Cycles and their mirror opposite (Inverted Cycle) will have approximately the same number of bars, take a look: One more thing worth mentioning, if I haven't already; Regular Cycles and their mirror opposite (Inverted Cycle) will have approximately the same number of bars, take a look:
 Well, if you have stuck with me thus far, you would probably like to know just how the heck you might approach trading these Concepts. Well, thankfully J.R. Stevenson included some very simple strategies for trading both with the trend, and counter to the trend. Here's what he says: Well, if you have stuck with me thus far, you would probably like to know just how the heck you might approach trading these Concepts. Well, thankfully J.R. Stevenson included some very simple strategies for trading both with the trend, and counter to the trend. Here's what he says:
For trading with the trend;
If an RC is up, Buy a CTL break
If an RC is down, sell the PTT
If an IC is up, Buy the PTT
If an IC is down, sell a CTL break
Got that? Good!
Now if you prefer to counter-trend trade the cycle, he suggests;
If an RC is up, Sell the PTT
If an RC is down, buy a CTL break
If an IC is up, sell CTL break
If an RC is down, buy the PTT
Simple right?
Just keep in mind that to determine the direction of the cycle's trend from the slope of the A -C line (if a Regular Cycle) or the slope of the B-D line (if in a IE).
OK, OK, I'll demonstrate:
 So, these are three good examples that demonstrate relative accuracy, but also the important matter of discretion that should come into play with these strategies. So, these are three good examples that demonstrate relative accuracy, but also the important matter of discretion that should come into play with these strategies.
- The first trade worked, so long as you bought on the close outside of that CTL (after all it was a strong bullish candle).
- The second trade didn't quite reach the PTT, so if you were eager you might have gotten in and perhaps quickly stopped out. Or, you might have waited for a pattern to develop.
- The third trade I included two purple CTL lines. If you would have bought the close outside of the CTL you would have been profitable in two days, before price broke down (fakeout breakout). Price continued lower, so you would have re-drawn the CTL to include these two consecutive new lows. In which case you got a break of the new CTL, and if you were hesitant to get in at this point (because you're still not out of that price range!) you would have (hopefully) waited for the breakout day to enter. If that were the case you would be sitting through a tight flag pattern before extending the initial impulse move. bravo! This measured move brought you right into the PTT target!
Needless to say, I'll be looking for a breakdown within this current Regular Cycle we appear to be in at this point.
OK, so one more example and then I'm ending this dissertation.
Looking at GS on a 5-minute time frame over the last two days (Thursday, Friday).
Here's what I see:  Going in a little closer, here's what I'm looking at: Going in a little closer, here's what I'm looking at:
 - The first trade coming out of the Regular Cycle down was to sell the PTT (that was not happening with such a steep selloff, as the PTT was skewed). However, you might have bought the retracement off the lows after breaking consolidation and testing the most recent swing high. - The first trade coming out of the Regular Cycle down was to sell the PTT (that was not happening with such a steep selloff, as the PTT was skewed). However, you might have bought the retracement off the lows after breaking consolidation and testing the most recent swing high.
- Next trade, going into a Inverted Cyle was to sell the CTL line break, which occurred on the retracement from the morning's sell-off. Target the lows of the day for at least half a position. Price doesn't make it to the PTT, instead double-bottoms at the Low of the day.
- Trade three: Buying a close outside of the CTL. Otherwise, look for a retracement back to this CTL to buy. We get a "Phoenix" setup and expand higher into our PTT!
- Trade four: Go short from the CTL break (and mini bear flag), target the PTT or lows of the day, which is what we got into the end of the day.
A word regarding failure:
These examples all look well and good, but taking action in real-time is another thing entirely. For one, your CTL is going to be changing with price. Say you have a close outside of the CTL, and you're thinking the cycle is over, well price may still continue lower/higher, in which case you may get stopped out. You will be readjusting the CTL accordingly, and it's best to rely on pullbacks, price patterns, and/or candlestick patterns to base your trading decisions rather than solely the CTL break.
Also, the PTT isn't going to be a hard and fast target. It would seem that price failing to make it to a PTT can be telling you a valuable lesson in what the pace of the market is doing, and perhaps that sentiment may be shifting.
So there ya have it! It's a fascinating study. I have enjoyed it very much and look forward to sharing what I find from here on out. I hope you stuck with me through, what I was hoping to be, a straightforward look into this concept. After all, it's really just a look into the wave structure of buying/selling that's generated across the tape, showing which has more weight to it, the buyers or the sellers. All a series of measured moves.
Here's another example using the past few days in SPY (5-min). What's worth noticing is that price arrived at the PTT early (Red line on lower right). Also, the CTL's (purple lines) are all retraced against sharply before price breaks down/out, providing an excellent low-risk entry.

hima reddy gave a presentation on stephenson's work and how to replicate it in a 4:30 PM webinar presentation on Thursday May 18th.
Hima Reddy, CMT is the Content Director for John Wiley & Sons, designing prep materials for all levels of the CMT exam and heading up instructional programs.
As an educator, Hima draws upon her broad base of experience as a financial analyst. From 2014-2016, she was a member of the technical analysis team at Piper Jaffray. Prior to that, Hima covered fixed income and foreign markets at Informa Global Markets. In 2012, Hima published The Trading Methodologies of W.D. Gann: A Guide to Building Your Technical Analysis Toolbox. In response to her readers, Hima began to share examples of the concepts in her book through a free blog focusing on the E-mini S&P 500 Futures lead contract. She has now launched this research as a subscription product.
Hima is a member of the Market Technicians Association, and she held positions as a CMT exam grader and question writer with the organization. Hima graduated from Indiana University's Kelley School of Business.
she gave a pretty good down to earth presentation on how to use the techniques in Stephenson's 2004
book...
she is expanding her market analysis service and has a special where you can get a free month of her
daily updates that come out around 8:30 AM.... as well as accessing her website and several videos and other materials there.
her offer is at this web link
www.himareddy.com/skinny-on-the-mini
she said that if anyone who sent in the completed form available at that location by midnight Friday could take advantage of her free special. You give them a credit card and they will bill $49 a month after the end of the first free month or you can cancel.
I'm giving it a go, partly because she was pretty level headed and it was not a heavy professional sales pitch. (I have seen lots of those!)
her website is www.himareddy.com is you want to go in and look around.
(I am not receiving any money or benefit from posting this) and for people like Mad-One and other power users of the Gartley pattern )
John

-------------------------------------
she has also written a book on Gann
The Trading Methodologies of W.D. Gann: A Guide to Building Your Technical Analysis Toolbox
W.D. Gann’s works helped to pioneer the discipline of technical analysis, and they still offer immense potential value to investors and traders. However, Gann’s original publications are esoteric and can be challenging to read and use. In this book, long-time trader and expert technical analyst Hima Reddy brings these works to life for modern traders and investors.
----------------------------------------------------------------
here are a few more charts from the blogger Toddstrade that provided the analysis of the Stephenson book
Sunday, January 17, 2010
Charts with PTT
Following up on my previous post regarding Stevenson Price & Time Targets, here are a couple charts I've been looking at:
TLT
Recently finished a Regular Cycle (RC) down. The overhead red line marks the PTT and the purple lines mark the Cycle Trend Line (CTL). 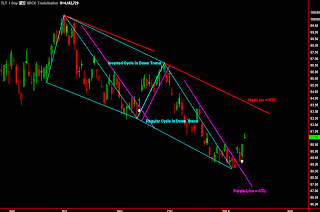 Within these larger cycles, there are also smaller cycles at play (though we should dial down too far, or risk falling down the rabbit hole. Notice that both cycles have approximately the same number of bars in them. The previous Regular Cycle ended when price closed outside the CTL (ended up retracing towards it before continuing). The Inverted Cycle's PTT was overshot, but arrived right on time (this is either showing us strength or short covering, or a combination of both being that price was right on top of long-running support. Within these larger cycles, there are also smaller cycles at play (though we should dial down too far, or risk falling down the rabbit hole. Notice that both cycles have approximately the same number of bars in them. The previous Regular Cycle ended when price closed outside the CTL (ended up retracing towards it before continuing). The Inverted Cycle's PTT was overshot, but arrived right on time (this is either showing us strength or short covering, or a combination of both being that price was right on top of long-running support.
 From here we look for a close outside the CTL to determine the end of the current Inverted Cycle (though we should prefer to wait for a retracement back to this CTL to gauge whether price wants to continue higher, or fall lower). The PTT of the Inverted Cycle is the most current red line on the chart, there is strong support above it though, and the slope of this down trend is beginning to flatten. From here we look for a close outside the CTL to determine the end of the current Inverted Cycle (though we should prefer to wait for a retracement back to this CTL to gauge whether price wants to continue higher, or fall lower). The PTT of the Inverted Cycle is the most current red line on the chart, there is strong support above it though, and the slope of this down trend is beginning to flatten.
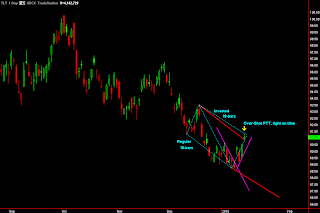
FCX
This stock finished the week, printing a Dark-Cloud Cover pattern, after filling a long-term gap. 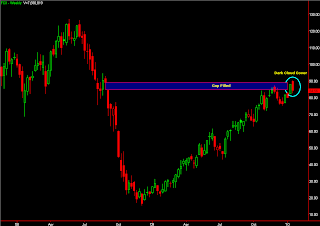 The daily chart shows the most recent end to an Inverted Cycle that actually hit the PTT early. The current PTT is drawn in red while the CTL is purple. There are two clear possibilities; (1) Continued downside, where we could target the PTT, and perhaps look to buy a bounce, or (2) Price makes an attempt to tag the CTL above, in which case I would be looking to sell this move. The daily chart shows the most recent end to an Inverted Cycle that actually hit the PTT early. The current PTT is drawn in red while the CTL is purple. There are two clear possibilities; (1) Continued downside, where we could target the PTT, and perhaps look to buy a bounce, or (2) Price makes an attempt to tag the CTL above, in which case I would be looking to sell this move.
toddstrade.com
Stephenson's book must be pretty good... Amazon has a couple of seller's as $73 for a used copy of the book and there are a few people asking $200 and $300 for a new copy of the book.
amazon.com
it's always a good sign when you can not buy a book for a discount and several people are asking a substantial premium for it.
John |


