Morning Round-up -- USD continues to weaken as the EUR and a number of the top tier major foreign currencies move north...... US Equity fundamentals show improvement by several metrics and the Assets under management by Algorithmic trading and smart beta risk parity investing continues to expand.
All while the World has changed to where derivatives in the form of the number of ETF's have surpassed the number of individual stocks in the public stock market. This is one of the more insidious and counterproductive aspects of over zealousness of Dodd Frank regulation.... cost strangulation on the ability of the capitalist system to enable companies to go public the way they could for 125 plus years....
This regulatory overreach has hurt economic growth and curbed the entrepreneurial and dynamic nature of American Capitalism.... No wonder we have not seen 4% GDP growth in 20 plus years.
5 Year USD Weekly chart -- the USD index continues to weaken downward

The Daily USD Index----- we are in the area of support zone of 96.26 - 96.00... this is support that should hold and produced an intermediate to longer term base, and could easily be a 18- 28 Month Bottom.

Equity Markets1. Earnings growth for the S&P 500 companies has improved substantially, as the drag from energy/natural resources firms is reversed.
This will work to reduce the very top of the range EPS numbers the US stock market has been generating and lower the market's "overvaluation" on the Shiller CAGE and similar metrics.

Source: @bySamRo; Read full article
2. For the first time in a while, we see more companies beating on their top line figures rather than the bottom line estimates (as sales improve).

Source: @bespokeinvest; Read full article
3. Nonetheless, we’ve had quite a bit of negative guidance for the second quarter. The Wall street analysts and
corporate CFO's know the drill to tamp down expectations and set up an expectoration matrix were companies can
beat on modest forward guidance

Source: @FactSet, @LarryFeldmanNYC; Read full article
4. US M&A activity has slowed. That is a drag on Investment Banking earnings.

Source: @jessefelder, @FactSet; Read full article
5. Stock trading is increasingly dominated by quant funds (managers who use algorithmic trading). This and the
Seminal event we have recently witnessed where the number of ETF's now exceed the number of actual stocks in the Wilshire 5000 and on the NYSE and NASDAQ; this brave new world were the ETF's which are derivatives, many of which apply leverage and other smoothing techniques is placing us in a brave new world where we don't know how
efficiently markets can reprice smoothly when the next "Black Swan" event arises. This is a truly significant Tail risk
that shall test the market at some point over the next 6 to 24 months......

Source: @jessefelder, @LarryFeldmanNYC; Read full article
6. US smart beta AUM continues to rise. This coupled with the proliferation of Index investing espoused by Warren
Buffett and Vanguard's founder Jack Bogle and then compounded by the supremacy of the Number of ETF's eclipsing actual stocks coupled with Paul Tudor Jones's warnings on the dangers of the new paradigm of "risk Parity"
Bloomberg put Paul Tudor Jones down warning the audience at a closed-door Goldman Sachs Asset Management conference that:
the value of the stock market relative to the size of the economy -- should be “terrifying” to a central banker
I have highlighted this ratio in two separate recent pieces ( here and here)
Tudor Jones adds a new piece to the puzzle by identifying the rise of risk parity as a strategy as a potential accelerant in a sell-off.
Risk parity isn’t a strategy that’s easy to pinpoint. Managers implementing it try to create a better risk/return compared to the 60/40 portfolio, a noble endeavour, by spreading investments across asset classes and weighing them so they contribute to risk equally. If you think about the 60/40 portfolio as a stock/Treasury portfolio it is intuitive the stock allocation under most circumstances represents most of the risk. AQR is implementing the strategy in a number of funds labeled AQR Risk Parity ( AQRIX) ( QRMIX) and Bridgewater runs the All Weather portfolio.
The result is of course the risk parity portfolio is much less risky in the sense of being less volatile. It also offers lower returns which makes sense given the higher allocation to bonds. This is solved by adding leverage as demonstrated in the table below by Schroders:
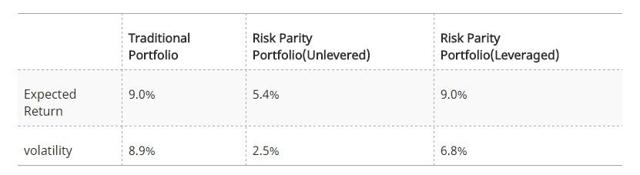
Basically risk parity represents a leveraged low volatility portfolio while the traditional portfolio is more volatile but doesn’t have the leverage.
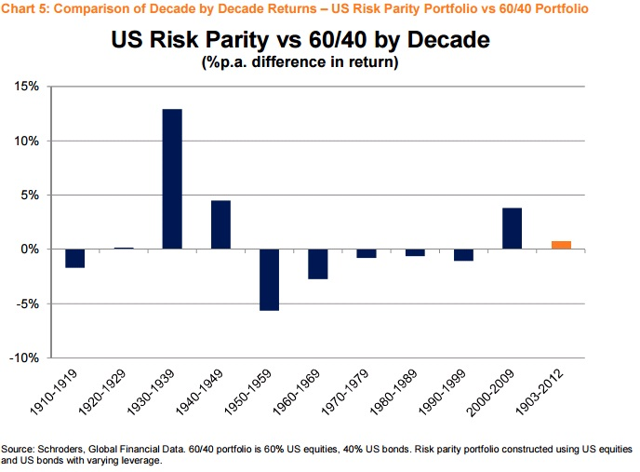
Schroders research on risk-parity isn’t conclusive but it offers some support for the experiment by the way:
Consequently, while the risk parity portfolio has outperformed over the entire sample period, this outperformance has been episodic and is heavily biased to the 1930-1950 period and the most recent decade of 2000-2009.
There are things I like and dislike about the risk-parity approach but one important thing to note is it potentially magnifies problems if you get the volatility input wrong.
Hammer on the downsideWhat I believe Tudor Jones is getting at when he’s saying risk parity will be the "hammer on the downside"; once a stock market sell-off starts to gain some traction volatility will rise.
That’s not an unreasonable assumption as when the stock market takes a step back it usually happens over a short period of time. It's the bull markets that run for 8 years.
When risk parity strategies would subsequently adjust their allocations based on the new volatility measures they would then dial back equity exposure. As these are by definition leveraged funds the impact will be greater as suggested by asset under management figures.
I am already very cautious given the valuation level of the U.S. market and dislike low-volatility strategies to the extent that I’ve shorted a S&P 500 low volatility ETF because the factor is one of the most overbought and likely to be swiftly abandoned when it underperforms.
Risk-parity hasn’t really been top of mind for me but I do believe the acceleration theory is credible to an extent. If this effect is underestimated out of the money puts on the S&P 500 could be underpriced for example.

Source: @WSJGraphics; Read full article
7. The correlation between the S&P500 and dollar-yen has risen to a one-year high. Political “jitters” in the US send investors out of stocks and into yen (the yen trades with safe-haven assets). Of course, investors tend to come right back into US stocks.

Source: Credit Suisse
Definition of smart beta
Some investors are moving away from traditional market capitalisation-based indices to alternative strategies, known as smart beta, in search of better returns and lower costs amid volatile markets and an uncertain economic climate. [1]
Smart beta is a rather elusive term in modern finance. It lacks a strict definition and is also sometimes known as advanced beta, alternative beta or strategy indices.
It can be understood as an umbrella term for rules based investment strategies that do not use the conventional market capitalisation weights that have been criticised for delivering sub-optimal returns by overweighting overvalued stocks and, conversely, underweighting undervalued ones.
This last statement is indicative of this market where the concentration and market capitalization of the FANG stocks and the top tier of super Mega Capitalization stocks can sow the seeds of a market dislocation if a exogenous shock encouraged panic selling in the plethora of ETF and leveraged ETF's which hold by definition high quantities of overweighted, overvalued stocks.
Smart beta strategies attempt to deliver a better risk and return trade-off than conventional market cap weighted indices by using alternative weighting schemes based on measures such as volatility or dividends. [2]
Smart beta refers to an investment style where the manager passively follows an index designed to take advantage of perceived systematic biases or inefficiencies in the market. It therefore costs less than active management, since there is less day-to-day decision-making for the manager, but since it will, at the very least, have higher trading costs than traditional passive management (which minimises those costs), it is a pricier option. [3]
Among the best known alternatives to market cap weighting are the fundamentally weighted indices developed by Research Affiliates in 2005 which rank their constituents by book value, dividends, sales, and cash flow.
However, even a naive weighting scheme such as equally weighted indices can be described as smart beta.
Interest in smart beta indices has been fuelled by the global financial crisis of 2007-08 which prompted many investors to become more focused on controlling risks than simply maximising their returns.
One of the key attractions of smart beta is that it is less expensive for investors to evaluate the worth of these strategies than to analyse and monitor the performance of active managers.
Smart beta can also be understood as the returns that can be generated from illiquid or private markets such as real estate and infrastructure which offer attractive risk return trade-offs and which can provide important diversification benefits when added to a conventional portfolio of equities and bonds.
Example
Some investors would also include thematic strategies under the smart beta umbrella by building portfolios that provide exposure to demographic trends or to particular sectors such as agriculture, timber and natural resources. [4]
Smart beta options might include fundamental indexed investments or catastrophe bonds.
9. The “America First” bet in the stock market isn’t working out so well. The global recovery is boosting the contribution of foreign earnings.

Source: @bespokeinvest; Read full article
10. Speculative accounts have built a massive short exposure to VIX futures. This next chart combines volatility futures with ETFs.

Source: @tracyalloway, @Pravit_C
Here is a note on the subject from Jim Carroll, Managing Partner of LongRun Capital Management.
As if to prove that last Wednesday was nothing but a bad dream, this chart of the four CBOE volatility indices shows that volatility is back to almost the identical low levels that we saw the day before the seismic event. If the eruption was meant to scare all those people who were short volatility, it would appear that they have dusted themselves off and re-loaded.

Back to Index
Credit1. The tightness in the interbank markets has eased substantially in recent months.

Part of the reason for this easing is the money market fund regulation that went into effect last year, which forced some foreign banks out of US lending by raising their dollar funding costs. The unintended consequence of this regulation is less financing for US firms. Here is the year-over-year growth in business loans made by foreign banks (which is dragging down the overall credit expansion in the US).

With a declining need to fund dollar assets, foreign banks are borrowing less from US banks, reducing the tightness in the interbank market. For some reason, the financial media is completely ignoring this development.
2. Merrill Lynch’s private clients are loading up on leveraged loans.

Source: BofAML
In fact, demand for this floating-rate product is outstripping the available supply.

Source: @lcdnews; Read full article
May 22, 2017 at 11:31am
Leveraged Loans: As Cash Inflows Ease, Issuer-Friendly Market Trends Toward Equilibrium

The U.S. leveraged loan market, which saw booming activity in the first quarter of 2017, as issuers took advantage of huge investor cash inflows to market, is showing signs of cooling.
The amount by which the supply of deals available in market was outweighed by investor demand for that paper dipped to $5.6 billion in April, according to LCD. While that’s still a considerable amount, this is the third straight month that demand has eased (albeit from a whopping $14.2 billion in January).
Any market rebalance would be welcome by institutional investors, who have been under siege this year from leveraged loan issuers looking to cut interest rates on existing deals (sometimes on credits put in place only months ago). Indeed, repricing activity topped an astronomical $100 billion in January.
Why the demand surge? Since the third quarter of 2016 investors have been pouring cash into U.S. loan funds and ETFs amid expectations of regular interest rate hikes, finally, in 2017 (of course, as rates rise, floating-rate asset classes such as leveraged loans tend to fare well).
Lately, however, those cash inflows to market have slowed as a second – and especially third – rate hike in 2017 look less of a sure thing than they did earlier this year due to a recent dip in inflation and inflation expectations. – Staff reports
3. Shares of Santander Consumer USA continue to drift lower as investors get nervous about rising (second chart below) auto loan delinquencies (Santander is extremely active in subprime auto).


Source: @WSJ; Read full article
4. US farm delinquencies jump as grain prices remain depressed (second chart below).

Source: wolfstreet.com; Read full article

Back to Index
Energy Markets1. The OPEC oil export revenue hit the lowest level since 2004. No wonder Saudi Arabia was so welcoming to
President Trump's visit as the kingdom ( 70% of whose population are under 30 year old) are keen to diversify away
from a Crude Oil dependant economy... which is very scary with the 78% decline in crude in 5 months in 2008 and the prolonged bear market in prices since late 2014.

Source: @JavierBlas2, @EIAgov, @Andreas; Read full article
2. Money managers have dramatically cut back on their net-long crude oil exposure.(This should be net bullish for crude over the coming 12-24 months) one of the biggest drags on Crude this year is that it's Globally denominated in
US Dollars and the dollar index has come down from almost 104 in Dec down to a 96 handle... which is a depressant on the price of overseas Oil when converted into local currency terms.

Source: @JKempEnergy
JJP |


