The spectacular failure of the 2007 climate "bet" by denier J. Scott Armstrong
Sou | 1:20 AM

Today at WUWT there's a rambling, indecipherable article about some bet that a science denier called J. Scott Armstrong unsuccessfully tried to make with Al Gore way back in 2007. It's a tale of a failed denier prediction, and worse. Having failed so spectacularly, J. Scott Armstrong is doubling down and betting on a drop of up to 4.5 °C in global temperature over the next decade.
Armstrong was wanting to bet that there'd be no change in global average surface temperatures between 2008 and 2017. He figured, wrongly, that Al Gore would bet there would be warming. Al Gore didn't take the bet. Why would he deal with a nincompoop denier like J Scott Armstrong.
Armstrong's first draft of the bet was a bit weird. The essence of it was this:
Al Gore is invited to select any currently available fully disclosed climate model to produce the forecasts (without human adjustments to the model’s forecasts). Scott Armstrong’s forecasts will be based on the naive (no-change) model; that is, for each of the ten years of the challenge, he will use the most recent year’s average temperature at each station as the forecast for each of the years in the future. The naïve model is a commonly used benchmark in assessing forecasting methods and it is a strong competitor when uncertainty is high or when improper forecasting methods have been used.
Specifically, the challenge will involve making forecasts for ten weather stations that are reliable and geographically dispersed. An independent panel composed of experts agreeable to both parties will designate the weather stations. Data from these sites will be listed on a public web site along with daily temperature readings and, when available, error scores for each contestant.
Starting at the beginning of 2008, one-year ahead forecasts then two-year ahead forecasts, and so on up to ten-year-ahead forecasts of annual “mean temperature” will be made annually for each weather station for each of the next ten years. Forecasts must be submitted by the end of the first working day in January. Each calendar year would end on December 31.
The criteria for accuracy would be the average absolute forecast error at each weather station. Averages across stations would be made for each forecast horizon (e.g., for a six-year ahead forecast). Finally, simple unweighted averages will be made of the forecast errors across all forecast horizons. For example, the average across the two-year ahead forecast errors would receive the same weight as that across the nine-year-ahead forecast errors. This unweighted average would be used as the criterion for determining the winner.
Terms of the challenge can be modified by mutual agreement.
Version 2 of Armstrong's "bet" from 2008
The following year, after it was clear that Al Gore wasn't playing, he changed it to this, where he made it clear he was basing the bet on the Hadley Centre data:
Al Gore is invited to select any currently available fully disclosed climate model to produce the forecasts (without human adjustments to the model’s forecasts). Scott Armstrong’s forecasts will be based on the naive (no-change) model; that is, for each of the ten years of the challenge, he will use the most recent year’s average temperature at each station as the forecast for each of the years in the future.
Details on the 10-year bet would be handled with discussions between me the Hadley Centre. I would ask an independent board to aid in this process of finding an appropriate design and to monitor the progress of the bet. You would be kept up to date, and you would have the right to ask the board to consider changing aspects of the design.
Version ? of Armstrong's "bet" from 2016
More recently he changed it from surface temperature to lower troposphere temperature as recorded by UAH. I don't know exactly when he decided to give up surface for lower troposphere, but it was very recently going by Wayback Machine records, some time between 15 September 2015 and 2 March 2016, probably January 2016.
Never mind. J Scott Armstrong and his ally in denial, Kesten Green, didn't do at all well with their bet that there'd be no change in global temperature, whether surface or lower troposphere. Here are some comparisons.
Not the best bet
First of all, here is what would have looked like if Armstrong had chosen NASA's GISTemp. The brown lines are what was observed since 2007 and the red line is the "no change" from 2007:
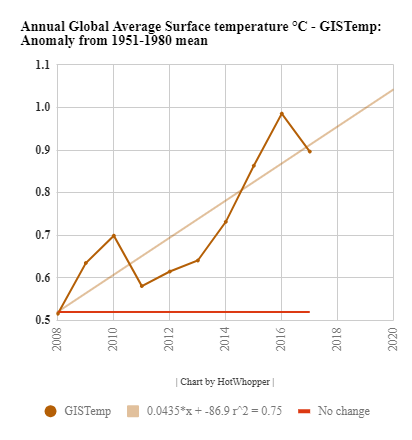
Figure 1 | Global average surface temperature from 2008 to 2017 inclusive. Data source: GISS NASA
The linear trend for the ten year period is 4.35 °C/century. The actual difference between 2008 and 2017 is 0.38 °C.
Below is the same plot for HadCRUT, Armstrong's initial choice.
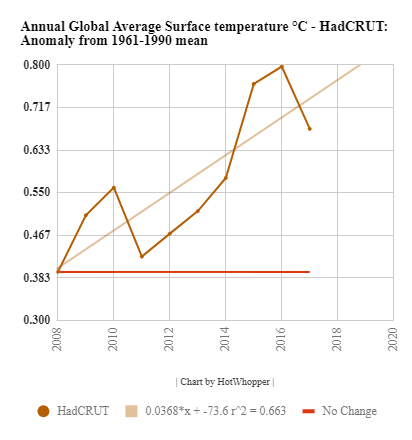
Figure 2 | Global average surface temperature from 2008 to 2017 inclusive. Data source: Met Office Hadley Centre
The linear trend for the ten year period is 3.68 °C/century. The actual difference between 2008 and 2017 is 0.28 °C.
Then there's the 2016 revision of the "bet" that wasn't. The change in UAH lower troposphere temperatures over the period. Version 6 of UAH was released in April 2015, and it's the only version that covers the period from January 2007 to December 2017. Version 5.2 would have been the current version at the time the bet was conceived, and it looks as if that was last published in 2010. Version 5.6 stops at July 2017.
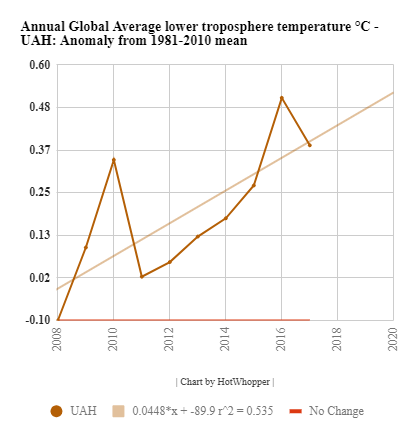
Figure 3 | Global average lower troposphere temperature from 2008 to 2017 inclusive. Data source: University of Alabama Huntsville
The linear trend for the ten year period is 4.48 °C/century. The actual difference between 2008 and 2017 is 0.48 °C over the period.
So, by whatever measure, J Scott Armstrong lost his would-be bet. I wonder why Anthony Watts posted that strange article, given he's a global warming denier. His article had a question as the headline: Tipping point 10 years on: Who won the Armstrong-Gore ‘bet’ on the climate?
Observed change is higher than IPCC's 2007 projected per century trend
The WUWT article kept referring to an "IPCC 3°C-per-century projection". The IPCC report of 2007 (the year Armstrong tried to make the bet) listed different projections, depending on what scenario we humans chose to follow. If we were to follow the scenario preferred by deniers, the best estimate of temperature change was projected as 4 C higher in 2090-2099 relative to 1980-1999. If we were to follow the scenario preferred by the other 90% of the human race (no change in atmospheric CO2), the best estimate was projected as 0.6 °C higher in 2090-2099 relative to 1980-1999. This is from the AR4 2007 IPCC report:

I guess that J Scott Armstrong and Kesten Green (his partner in crime) were expecting somewhere between the A1B scenario and the A2 scenario.
Implausible simulations from the denier duo
Quite weirdly, despite the ongoing increase in atmospheric CO2, the article at WUWT claimed that there was a 70% chance that there wouldn't be any increase in global temperature over the past ten years or so. I don't know who did the simulation, but I wouldn't give them any prizes:
A 150-year simulation of the bet suggested that his chance of winning was only about 70%.Shifting goal posts wasn't wise
The WUWT article also claimed:
In the end, the bet was offered, and monitored, on the basis of satellite temperature data from the University of Alabama at Huntsville (UAH).As I pointed out earlier, the "end" looks to have been about eight and a half years after the original ten year bet was proposed. Some sad end :( He should have stuck with HadCRUT, because that showed the smallest increase and the lowest trend over the period.
The article waffles on about cumulative absolute errors and other gumph, and the most telling part was this graphic inserted somewhere near the bottom of the article:
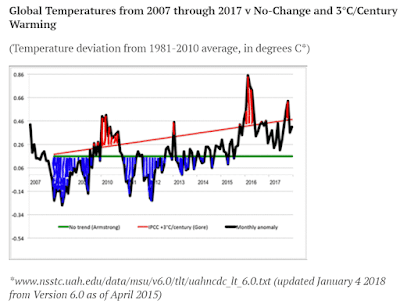 | | Figure 4. Graphic from WUWT showing just how bad the Armstrong projection turned out to be. |
I wouldn't trust it a great deal, given it's from WUWT. However even if it were an accurate representation of what it purports to be, the chart shows that UAH temperature is pretty close to the 3 °C per century trend. (As shown in Figure 3 above, the linear trend for UAH v6 is substantially higher than 3 °C per century, at 4.48 °C/century.)
It can only get worse for J. Scott Armstrong
Even more weird is that apparently J. Scott Armstrong is going to hang out for significant global cooling over the coming decade. From the WUWT article:
Longer is better for assessing climate forecasts, and so theclimatebet.com site will monitor the “bet” in line with Scott Armstrong’s offer to extend the challenge for another ten years by sticking with the original 2007 annual average global temperature as the starting point. Extending the bet is intended to help further publicize the important role of scientific validation of forecasts that influence public policy. Policymakers should reject forecasts that fail to reduce errors compared to an appropriate no-change benchmark.
blog.hotwhopper.com |


