We put on a small short term position in the SOXS this afternoon....... THE 3x Leveraged ETF's have significant
decay and so they are a position to be rented.....
Doug Kass has commented that the 3 x ETF's are ones that you want to rent...... not own them......
Kass was commenting specifically on the SQQQ.
several of the markets are really coiled up..... and interesting, it the US interest rate futures markets, and
the currency markets.... that are more apt to have a big move due to unwinding of some big leveraged
positions as contrasted with US equities........ ( now that is a subjective opinion and is very difficult,
if not impossible to quantify, imo)
it the SPX makes a new high and closes above 2873..... I'll be out real quick.....
-------------------------------------
How To Beat Leveraged ETF Decay
May 23, 2013 12:08 PM ET|45 comments | Includes: AGQ, GLD, IWM, OIL, SLV, SPY, SSO, TNA, UCO, U
Leveraged Exchange Trade Funds (ETFs) and related Exchange Trade Notes (ETNs) aim to provide investors with a multiple (2x, 3x) or inverse multiple (-2x, -3x) of an underlying asset's or benchmark's daily movement. While in the right hands these funds can be an extremely powerful tool, the nature of the beast is that the methods used to produce leveraged price movements inevitably erode away the long-term performance of these funds.
As a result, Spivak summarizes the typical sentiment investors hold regarding leveraged funds:
"...it is NOT a long-term investment - in fact, it is a one-day trade (or at most, a few days). It appears that the investor must anticipate a price spike, buy, and then sell immediately (within a few days at most), to make money."
Since their inception leveraged funds have certainly had their share of doubters. Michael Johnston of ETF Database provides an excellent myth-busting article to many of their points; yet even he only partially addresses the true issue of long-term price decay.
In this article I've set out to shed some light on the big bad boogie-man that is "leveraged fund decay" and walk through how to quantify, as closely as possible, what the actual cost is to hold these leveraged funds. Beat this cost, and the prospect of compounding long-term leveraged gains becomes attainable.
I'll look at 5 major asset classes and their 2x and 3x ETF alternatives, provided by the table below:
Asset
Benchmark ETF2x ETF3x ETF|
Gold
| SPDR Gold Trust (NYSEARCA: GLD) | ProShares Ultra Gold (NYSEARCA: UGL) | VelocityShares 3x Long Gold ETN (NASDAQ: UGLD) | | Silver | iShares Silver Trust (NYSEARCA: SLV) | ProShares Ultra Silver (NYSEARCA: AGQ) | VelocityShares 3x Long Silver ETN (NASDAQ: USLV) | | Oil | iPath S&P GSCI Crude Oil TR Index ETN (NYSEARCA: OIL) | ProShares Ultra DJ-UBS Crude Oil (NYSEARCA: UCO) | VelocityShares 3x Long Crude ETN (NYSEARCA: UWTI) | | S&P 500 | SPDR S&P 500 (NYSEARCA: SPY) | ProShares Ultra S&P500 (NYSEARCA: SSO) | ProShares UltraPro S&P500 (NYSEARCA: UPRO) | | Russell 2000 | iShares Russell 2000 Index (NYSEARCA: IWM) | ProShares Ultra Russell2000 (NYSEARCA: UWM) | Direxion Daily Small Cap Bull 3X Shares (NYSEARCA: TNA) |
To begin, throw out the notion that leveraged fund decay is some esoteric phenomenon of investing in "sketchy" market instruments. Rather, its the combined effect of three separate and very tangible components: Fees and Expenses, Rebalacing Costs and Volatility Decay.
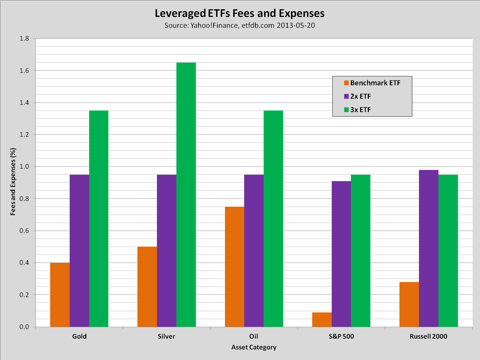
The first component of leveraged fund decay is simple. Like typical ETFs and ETNs, leveraged fund managers charge a fee to manage the assets of the fund with the added cost of running a leveraging system. As the table below shows that cost can be at a significant premium to the fund's underlying benchmark:
The second component of decay is the result of inefficiencies in the leverage vehicles of these funds. Most leveraged funds utilize a combination of futures contracts and swap agreements to achieve their desired leveraged exposure. Since these agreements take place daily there's room for unrealized market movements. Essentially, leveraged funds might buy high and sell low. The constant buying and selling of agreements and assets results in a loss, or rebalancing cost, between days. Note most leveraged funds provide an ideal 2x/3x index that they attempt to track. In a perfect world fund managers would simply report these rebalancing costs, but luckily they're not too hard to calculate ourselves.
To calculate rebalancing costs we can compare the annual percent yield of a particular fund with that of its index. Subtracting the known expense ratio from this difference leaves us with the rebalacing costs. Keep in mind when doing this calculation that funds can and do change their fees over time. The chart below illustrates this math for our gold funds within the last year:
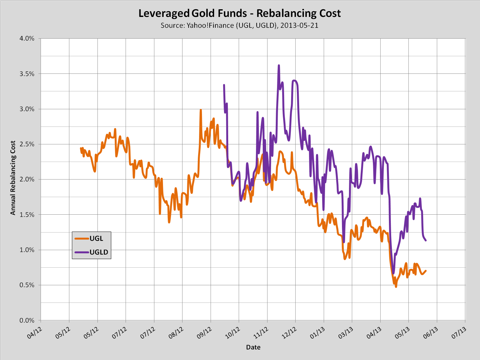
Keeping track of these costs is essential in determining how long to hold these funds. If you start to sense rebalacing costs are getting out of hand, don't feel the obligation to remain loyal. Interestingly, rebalancing costs have no correlation to a benchmark's price swings; don't assume low beta funds offer the lowest holding costs. Do however track those price swings, because they are the make-it or break-it for leveraged funds.
These swings produce the last component, called volatility decay. This decay results from complexities in the mathematics of compounding and price volatility. Before investing in leveraged funds investors should be very familiar with the compounding phenomenon. ProShares provides a good 2-page reference.
Volatility decay occurs for two reasons, both happening when price trends swing from day to day. The first is reversing negative movement. As prices are pushed exponentially lower in a downtrend, any positive daily movement (on a percentage basis) now becomes subsequently smaller. The second, reversing positive movement, exacerbates this problem. When prices are pushed exponentially higher, any negative price movement (on a daily percentage basis) will now take a larger chunk out of the fund's price. The net result is all leveraged funds that use a daily percentage methodology will always experience some degree of long-term price decay. This is true regardless if the fund is normally leveraged or inversely leveraged.
To calculate volatility decay we must correlate the annual percent yield (apy) of the index with that of the benchmark. This will generate a "pseudo-compounding curve" chart. The chart for GLD's 2x and 3x index are below:
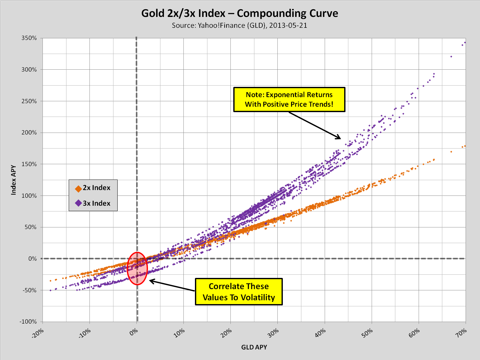
This correlation provides a trove of information, but for now since we're only concerned with the effects of volatility on our 2x/3x index, we must focus on only the values for when the benchmark's apy is 0%. By pulling these data out and then correlating them to the benchmark's volatility (or beta) we can realize the detriment volatility plays on these funds. I'm using annual standard deviation as volatility, but however you choose to calculate it the results will be similar:
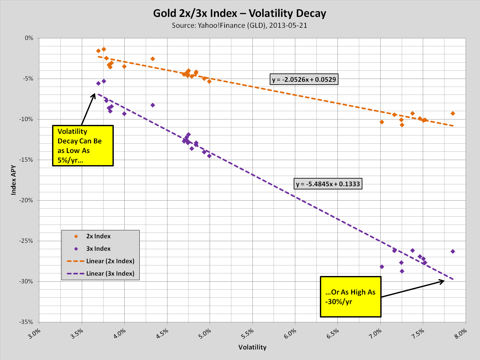
Wow! For a 2x leveraged gold fund volatility decay can approach 10% a year, but for a 3x fund it can shoot all the way to 30%. For those who remember their linear algebra the "m" of these correlations is the index's sensitivity to volatility. For a 2x leveraged gold fund, every 1% increase in volatility translates into a 2.05% loss for the year. For a 3x leveraged fund, 5.48%.
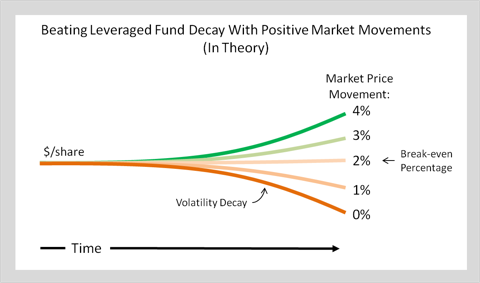
While it seems the universe at its core must be out to get leveraged fund investors, there is some simple calculus that we can do to help rebalance the odds. Knowing leveraged funds in a positive trend will grow exponentially (minus the 3 factors above), and those in a flat trend will inevitably decay, we can thus infer that there must exist some happy medium of price growth which can negate a fund's rate of decay. The image below illustrates this concept:
So how do we find this break-even percentage? Simply add up the 3 components we just calculated. The table below shows the current break-even percentages for our 5 asset classes. Note the first two components are the current values (which can actually fluctuate immensely), and volatility decay is the min-max range:
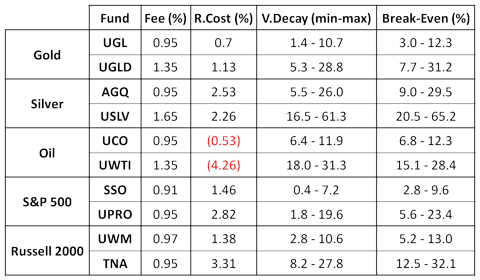
Yes, somehow leveraged oil funds are generating yield with their exposure strategy. While these break-even ranges seem unobtainably high, remember these values are specific to the leveraged fund. To calculate what that means for the benchmark, you need to go back to our Compounding Curve Chart and back-correlate the required apy. For instance, to achieve an upper break-even yield in SSO of 9.6%, this would only require the benchmark SPY to yield ~6%. Keep in mind, that's assuming average volatility.
If you prefer things visually, the chart below illustrates what UGL's break-even range equates to the required price movement of GLD:
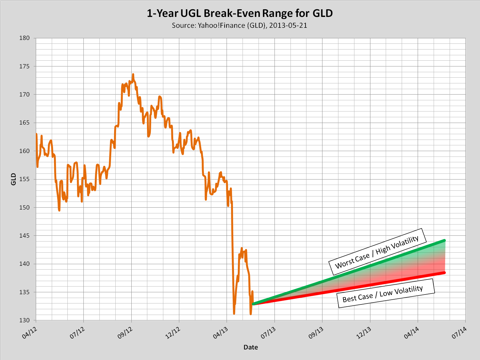
So there it is, in order for a long-term holding of UGL to break-even, gold must reach $1,438/ounce by this time next year with minimum volatility. If you as an investor feel confident an asset will make a movement within or above this range, why not consider a leveraged approach to maximize your gains?
Closing Remarks
Leveraged funds provide investors the ability to realize near 2x or 3x gains on daily movements in an asset class. However leveraged funds experience unavoidable price decay as the result of three different components working against the investor. Fees and expenses for these funds are higher, rebalancing costs result from inefficiencies in the leverage strategy, and volatility decay rears ever higher with choppier markets.
Despite this, the blanket notion that leveraged ETFs are for the short-play only is uninformed. If investors take the time to find a particular fund's break-even percentage, they can have a stronger understanding of just how much it costs to hold these funds. Should a market look poised to break above this percentage in either the short or long term, there's no excuse to cite the boogie-man for cheating yourself on double, even triple the potential gain.
As a final remark on these funds, if you look back at the sharp slope of the volatility decay correlation it presents a frustrating conundrum. When markets remain steady and positive, and if investors are patient, long-term holding of leverage funds has the potential to produce real exponential gains. The leverage strategies employed by these funds actually allows them to behave like turbo covered-call ETFs without the yield cap. However, the vast majority of leveraged fund buyers do so to take advantage of short speculation, potentially exacerbating volatility and subsequently reducing yield. The tragedy of the leveraged ETF.
http://seekingalpha.com/article/1457061-how-to-beat-leveraged-etf-decay |


