3 Reasons Stocks Are Straining To Get Over The Hump
Aug. 14, 2018 2:15 AM ET
Summary
Not everyone is convinced of the Goldilocks stock scenario.
Over the course of the economic expansion, strong GDP growth quarters have regularly been followed by weaker quarters.
A variety of risk-off cash equivalents provide meaningfully higher yields than stock dividends, offering an alternative to excessive stock exposure.
On median price-to-sales, the overall market is twice as expensive (a.k.a. “irrationally exuberant”) as it was during the tech bubble.
The correlation between new 52 week highs and the NASDAQ Composite’s price has decoupled.
The S&P 500 - a broad market barometer for U.S. stocks - last hit a record high six-and-a-half months ago. Why has the stock market failed to close above its previous peak set back on January 26?
The short answer is that not everyone is buying the media-hyped "Goldilocks" scenario.
Granted, the country is enjoying the near-term benefits associated with tax cut stimulus and relatively low interest rates. Employment trends have been favorable. Consumers are willingly spending both the money they have and the money they can borrow. And public corporations continue reporting strong profits-per-share.
On the other hand, the stock market may be in the process of forewarning a less-than-rosy year ahead. The investment community is scrutinizing the potential impact on everything from Federal Reserve policy to the Treasury bond yield curve, trade troubles to global growth weakness, stock valuation levels to forward return prospects, as well as uncertainty within key market internals.
Here, then, is a closer look at three of the biggest reasons that stocks are straining to reclaim January glory.
1. Economy: Growing, Growing, Growing… Gone.
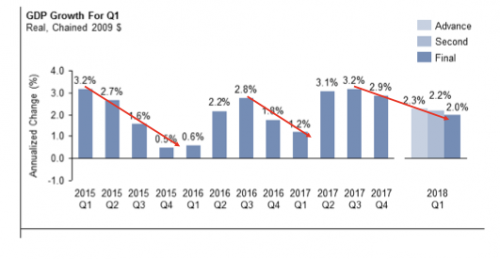
The mainstream financial media generated an enormous amount of enthusiasm for the initial reading of second quarter gross domestic product (GDP). And there's little doubt, 4.1% year-over-year growth is a fine number.
Yet over the course of the current expansion, GDP growth surpassed 4% on four other occasions as well. A bona fide lift-off failed to launch after each one of those occurrences. Over the last three years, in fact, strong growth quarters have regularly been followed by weaker data. Is there a persuasive argument why this time should be different?
 More notably, the U.S. economy cannot achieve sustainable above-trend growth (3%-plus) if the world economy is flatlining. Consider the reality that Q2 Eurozone GDP chimed in at an anemic 0.3%. That was its weakest performance since the second quarter of 2016. Meanwhile, the world's second largest economy, China, witnessed its manufacturing sector's PMI fall to 51.2 in July from 51.5 in June. More notably, the U.S. economy cannot achieve sustainable above-trend growth (3%-plus) if the world economy is flatlining. Consider the reality that Q2 Eurozone GDP chimed in at an anemic 0.3%. That was its weakest performance since the second quarter of 2016. Meanwhile, the world's second largest economy, China, witnessed its manufacturing sector's PMI fall to 51.2 in July from 51.5 in June.
Is monetary stimulus still bolstering these regions? Or have tariffs and trade threats sapped the collective confidence of global businesses and global consumers?
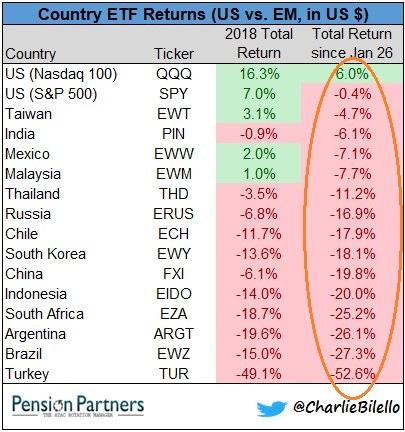
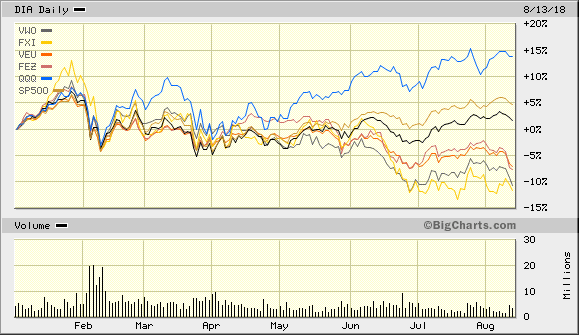
Regardless, world stock markets, particularly emerging markets, (ex U.S.) have been noticeably poor. They have been even more miserable since the equity top in late January.
2. You Say You Want A Valuation… Yeah, Well You Know.
For years, media pundits have been dismissing extraordinary exuberance for richly priced risk assets. The justification? Ultra-low interest rates. Bonds simply did not yield enough and cash was trash.
Indeed, a stock-friendly acronym surfaced. Specifically, "There Is No Alternative (TINA)."
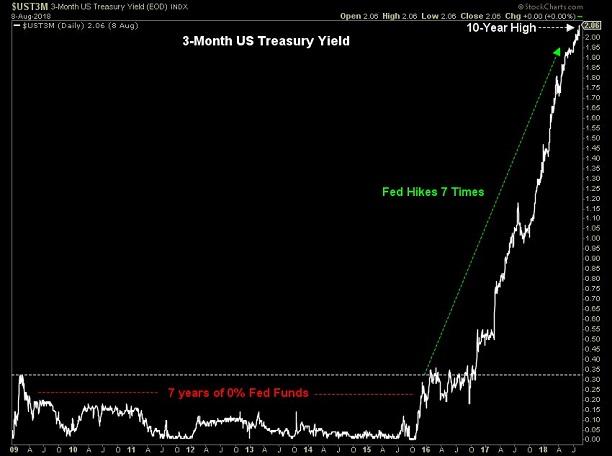
People do have choices in August of 2018, though. A cash equivalent like the 3-month T-Bill at 2.06% surpasses the dividend yield of the S&P 500 (1.79%). What's more, a variety of risk-off cash equivalents like iShares Short Maturity Bond ETF (BATS: NEAR) and PIMCO Enhanced Short Maturity (NYSEARCA: MINT) currently produce about 2.4%.
With the Fed tightening overnight lending rates as well as reducing its balance sheet, the "No Alternative" crowd has shifted its justification for exorbitant valuations to the "game-changing" nature of tax reform. Yet, few connect the dots on the fact that the earnings lift from tax cuts will lose the year-over-year comparison benefit in Q1 2019.
It is true that overvaluation has been pervasive for several years. In the absence of ultra-low and negative real rates, however, fiscal stimulus may not be the panacea that many in the media portray; that is, investors may cease to accept the notion that exorbitant stock valuations make sense anymore.
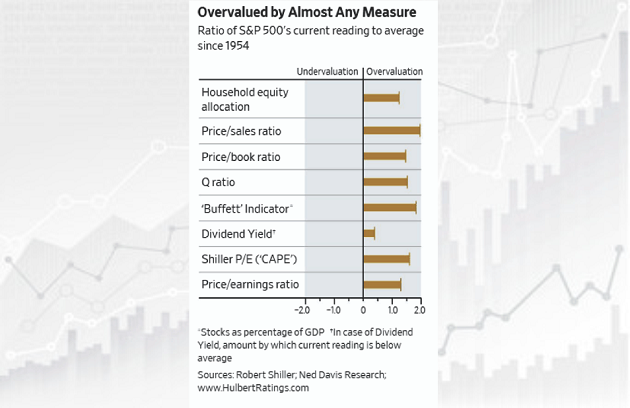
As it stands, the S&P 500 price-to-sales ratio (P/S) is as overvalued as it was during the tech bubble of 2000. Unfortunately, that's only half-the story - the market-cap weighted index story.
If one looks at the median stock in the S&P 500, and compares the S&P 500's median price-to-sales with 2000, the overall market is twice as expensive (a.k.a. "irrationally exuberant") as it was during the tech bubble. (Alongside record real estate prices, is it any wonder why some are calling today the "Everything Bubble?")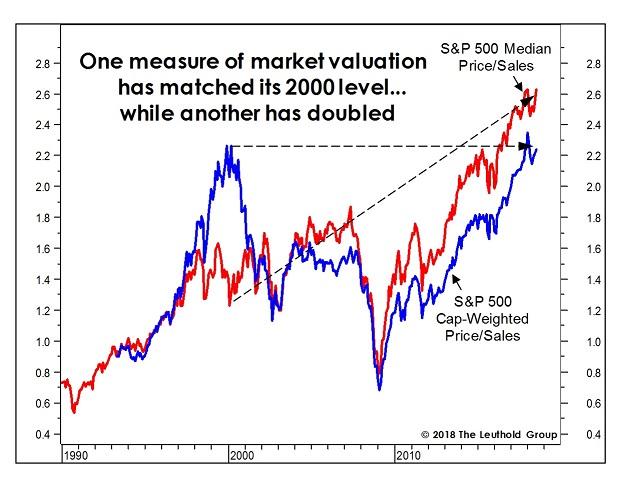
3. Breadth Stinks… Yeah, Yeah.
Lost in the excitement for market-cap weighted index success? Fewer and fewer stocks within those indices are registering new 52-week highs.
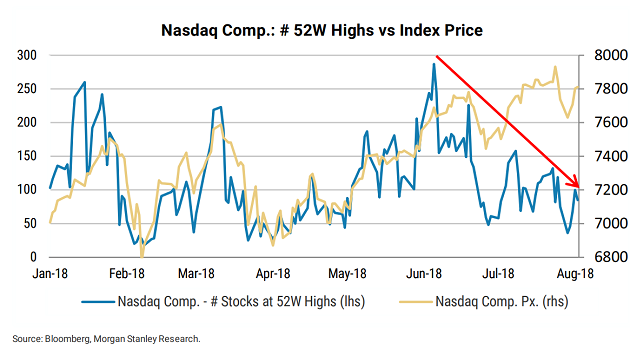
On the strength of popular FAANG names like Amazon (NASDAQ: AMZN), Google-Alphabet (NASDAQ: GOOG) (NASDAQ: GOOGL) and Apple (NASDAQ: AAPL), the Nasdaq Composite has appeared impervious to short-sellers and naysayers alike. Similar to shares of stock in the late 90s "New Economy," shares of NASDAQ darlings in a "Newer Economy" appear invincible.
Therein lies a problem. The NASDAQ as well as its Powershares proxy (NASDAQ: QQQ) have been logging record after record, though many of the NASDAQ's components have declined to participate.
Keep in mind, the correlation between new 52 week highs and the NASDAQ Composite's price had been strong throughout the first half of 2018. The correlation has since decoupled.
The weakening in market breadth may not be as pronounced on the New York Stock Exchange as it is over at the NASDAQ. However, it is still discernible.
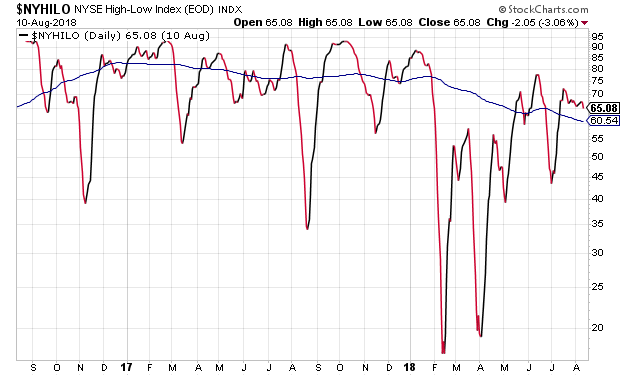
The NYSE's high-low index is a short-term moving average of the record high percent indicator, dividing the number of new highs by the number of new highs plus the number of new lows. The bullish trend was more pronounced throughout 2017 and up through January of 2018. The Hi-Lo Index frequently hit 85%-90%, while the 200-day moving average traveled between 75%-80%.
In contrast, peaks over the last three months as well as the slope of the 200-day demonstrate deterioration in breadth. While more stocks are still reaching 52-week highs than 52-week lows, the disparity is shrinking.
Bottom line? Even U.S. stocks may not be able to overcome the difficulties associated with central bank tightening, overvaluation and global economic weakness.
Does this mean investors should run for permanent cover? No.
That said, stock diversification across value, growth, large, small, foreign and domestic may not be able to provide adequate shelter from a shock to the system. In other words, have a plan beyond stock diversification alone to reduce the risk of severe loss.
seekingalpha.com |


