SI
SI
discoversearch

We've detected that you're using an ad content blocking browser plug-in or feature. Ads provide a critical source of revenue to the continued operation of Silicon Investor.  We ask that you disable ad blocking while on Silicon Investor in the best interests of our community.  If you are not using an ad blocker but are still receiving this message, make sure your browser's tracking protection is set to the 'standard' level.
Strategies & Market Trends : US Inflation and What To Do About It -- Ignore unavailable to you. Want to Upgrade?


To: John Vosilla who wrote (969)3/26/2019 7:05:38 PM
From: RetiredNow  Read Replies (1) | Respond to of 1504
 
I hope I am right. LOL. I would like a new, lower entry point right now. I think the stock market is just at bubble levels. Impossible to justify putting new money in there. You are likely right about commodities, though, because I think the dollar will be making new lows against everything due to the ridiculously low interest rates and end of QT imminent.


To: John Vosilla who wrote (969)3/26/2019 7:26:10 PM
From: RetiredNow  Read Replies (1) | Respond to of 1504
 
Wall Street Red Flag: An Indicator That Has Predicted Every Recession In The Last 50 Years Just Got Triggered

Authored by Michael Snyder via The Economic Collapse blog,

If the bond market is correct, the U.S. economy is definitely heading into a recession. Over the past 50 years, there have been six previous occasions when the yield on three-month Treasury bonds has risen above the yield on ten-year Treasury bonds, and in each of those instances a recession has followed. Now it has happened again, and this comes at a time when a whole host of other economic indicators are screaming that a recession is coming. Of course we have seen recession indicators triggered at other times in recent years, and the Federal Reserve was able to intervene and successfully extend this cycle on multiple occasions. But now that the global economy is clearly the weakest it has been since the last recession, have we finally reached a breaking point?

Many on Wall Street are taking what happened at the end of last week extremely seriously. According to CNBC, we have not seen a yield curve inversion of this nature in 3,009 trading days…
  • Short-term government fixed income yields are now ahead of the longer part of the curve, delivering a strong recession indication that hasn’t happened since 2007.
  • The spread, or yield curve, between the 3-month and 10-year Treasury notes just broke the longest streak ever of being above 10 basis points, or 0.1 percentage point. The two maturities were last below that level in September 2007, a run of 3,009 trading days, according to Bespoke Investment Group.
3,009 trading days is a very, very long time.

And now we will see how inverted the curve becomes, because as Zero Hedge has aptly pointed out, the more inverted the curve become the “higher the odds of a recession”…
  • Why is the inversion of the 3 Month-10 Year curve – the first since 2007 – such a momentous occasion? Because not only is said inversion the most accurate recession leading indicator, having correctly “predicted” the last 6 recessions with no false positives, most recently inverting in 1989, in 2000 and in 2006, with recessions prompting starting in 1990, 2001 and 2008….
  • … it also feeds directly into every Wall Street recession model: the more inverted it is, the higher the odds of a recession.
To get an idea of what the models are currently showing, just check out this chart. At this moment, the odds of another recession are the highest they have been since the last one.


Many investors were hoping that the bond market would have better news for us on Monday, but instead things got even worse
  • On Friday, markets were spooked when the yield curve inverted, a reliable recession signal though usually not an immediate one. That means the rate on a lower duration instrument rose above a longer duration security’s yield. In this case, it was the yield on the 3-month bill, at 2.44 percent Monday, moving above the 10-year yield, which sank as low as 2.38 percent, a more than 2-year low.
I know that just about everybody in America is writing about the Mueller Report right now, and I just posted an article about it too, but the outcome of that investigation is not going to change the trajectory of the global economy. It has been slowing down for quite some time, and that is the primary reason why we have seen an inversion of the yield curve
  • “Yield curves are responding to what they see, to what I believe is a global economic slowdown,” said Peter Boockvar, chief investment officer at Bleakley Advisory Group. “You don’t see this kind of move in curves, not just here but everywhere, unless you get one.”
Global central banks are already jumping into action, and I expect a tremendous amount of intervention as global economic conditions continue to deteriorate.

But there is only so much that they can do, and even though they have pulled a few rabbits out of the hat in recent years, at some point they are going to completely lose control.

Already, we are starting to see things happen that are very reminiscent of the last recession. For example, we are on pace for the worst year for store closings in all of U.S. history, and another major retailer just announced that they will be closing all their stores
  • LifeWay Christian Resources announced Wednesday that it will be closing all remaining 170 stores this year and focusing on online sales. Carol Pipes, director of corporate communications for LifeWay, posted the announcement on the company’s website, explaining that it was “a strategic shift of resources to a dynamic digital strategy.”
Communities all over America, especially the more economically-depressed ones, are going to start looking really bleak as the number of empty buildings continues to rise. This is something that I have warned about for a long time, and now it is happening on a massive scale.

As I end this article, I once again want to mention a factor that is going to have an enormous impact on our economy throughout the rest of this year. The flooding in the middle portion of the nation has destroyed thousands of farms, and the National Weather Service is warning that the flooding that we have seen so far is just “a preview of what we expect throughout the rest of the spring”. This is already the worst flooding disaster for U.S. farmers in modern American history, and it is going to get much, much worse.

We are going to see another huge surge in farm bankruptcies, thousands of farmers will not be able to plant crops at all this year, food prices are going to rise dramatically, and a lot of families all over America are going to have a real problem making their food budgets stretch far enough.

There are so many factors hammering our economy right now. If the Federal Reserve is able to pull another rabbit out of the hat this time, it will be nothing short of a major miracle.

We are literally at a critical tipping point, and it is not going to be easy to pull us back from the brink this time.


To: John Vosilla who wrote (969)3/27/2019 10:08:49 AM
From: RetiredNow  Respond to of 1504
 
The Staggering Amount Of Gold & Silver Investment Since The 2008 Financial Crisis

By the SRSrocco Report,

While the demand for precious metals is certainly off its highs from prior years, investors would be quite surprised by the astonishing amount of physical gold and silver investment since the 2008 financial crisis. Only by comparing the gold and silver investment demand to the prior decade, can we truly understand how the precious metals market has changed, and probably forever.

Now, before I get into the information, I wanted to say a few things about precious metals sentiment and the disillusionment, and at times, the outright disgust, by a percentage of former gold and silver investors. I am not going to name any names, but rather focus on the inability of these individuals to CONNECT THE DOTS in regards to the disintegrating Global Financial Ponzi Scheme.

And... for those few who still believe in the "Crypto Miracle," to overtake 2,000+ years of gold and silver as money, you have my sympathies. I am not going to get into any details, but just to say... don't count on High-Tech to solve our problems in the future. High-tech only creates more problems. So, if you believe high-tech is going to solve problems, then you don't understand the historical record on the "Collapse of Complex Societies."

Regardless, I believe part of the reason the "once" precious metals bugs, have now become quite frustrated, is that they have been taken in by the Mainstream Financial Koolaide. And why shouldn't they? Stocks and real estate prices have been going up and up, until recently, for the past seven years while the metals peaked, declined, and have been virtually flat.

Yes, it's frustrating to see the value of precious metals underperform the market while everything else seems to be heading toward the moon. But, that in itself should give anyone with a decent amount of intellectual know-how the ability to sniff out that... SOMETHING JUST AIN'T RIGHT. For some odd reason, all the negative aspects of the economy, the massive debt, derivatives, and leverage are all but forgotten when all we do is focus on the highly inflated stock, bond, and real estate asset values.

Unfortunately, the inability to see how the debt, derivatives, and leverage have created the biggest Global Ponzi Scheme in history will create the largest financial collapse ever witnessed, causing most investors to go bankrupt. It's only a matter of time, and time is running out.

So, when I write about gold and silver, I am not doing so because I want to see a 1,000+% gains in the metals (that wouldn't bother me either), but because there really isn't much else worth owning as "Liquid Investments" when the Phat Financial Lady finally sings. Thus, I don't focus on price targets or timelines, because that's a fool's game (one I was guilty of doing several years ago... no longer).

Frustration occurs when something doesn't happen when or how we expect. Which means, it's best to focus on the critical information, make one's investment decisions, and let the system unfold in its due time.

The 2008 Financial Crisis Was A Game-Changer For Gold & Silver InvestmentBecause we focus on day-to-day news, we tend to overlook longer-term trends. While short-term information is important, it doesn't override longer-term fundamental trends. Well, yes... maybe in some cases, but if we take the collapse of the Ancient Roman as an example, it cannot be attributed to just the events that occurred over the last few years of the empire, but instead, the centuries it took for its Falling EROI - Energy Returned On Investment, to destroy it from within.

Today, we are in the same predicament as the Ancient Roman Empire. However, the overwhelming majority of people don't see it because they are only focused on short-term results and information. Thus, to truly understand the future, we have to look back in the past. And, if we do this with gold and silver investment, we will see a very interesting trend.

According to some of the best industry sources, the World Gold Council and World Silver Surveys, investors purchased 16,200 metric tons (mt) of gold and 57,800 mt of silver from 2009-2018:


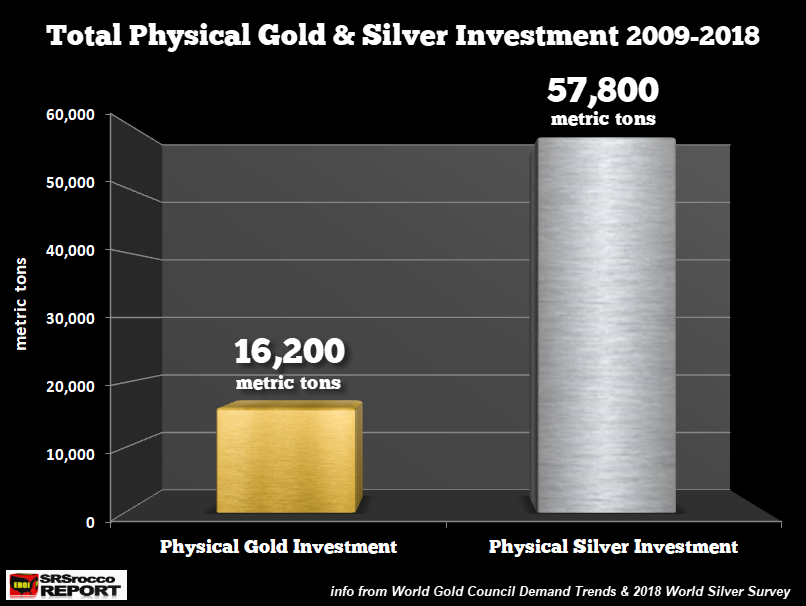
That turns out to be 520 million oz of gold and a nearly 2 billion oz of silver. Now, these figures only represent the physical bar and coin demand, including central bank net purchases. I did not include ETF's or similar products. First, there is no way of knowing if the gold or silver is over-subscribed in these precious metals ETF's or secondly, if all the metal that is listed, is contained in the vaults. So, the figures are likely much higher, especially for silver.

However, by comparing the total amount of physical gold and silver investment to the prior decade, we can see a significant difference:


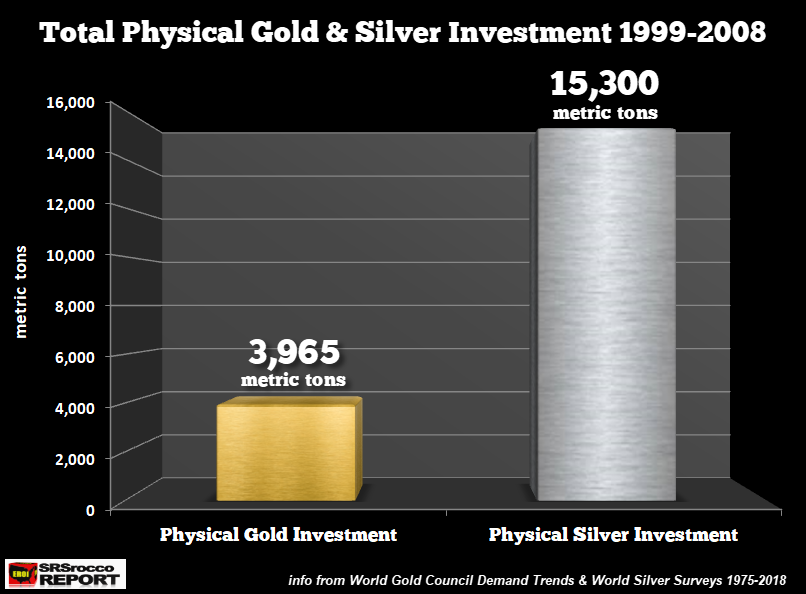
Total global gold physical investment from 1999-2008 was 3,965 mt versus 15,300 mt for silver. If we combine the information from both charts into one, investors purchased four times more physical gold and silver after the 2008 financial crisis:


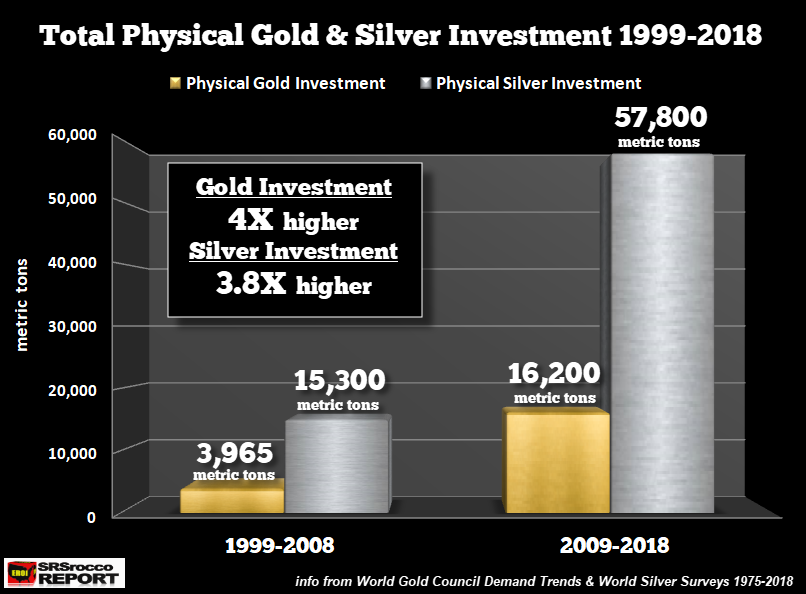
Global physical gold investment jumped by four times, while silver investment increased by 3.8 times (nearly four times). The average annual physical gold investment from 1999-2008 was only 396 mt and 1,524 mt for silver compared to 1,187 mt (gold) and 6,090 mt (silver) during 2009-2018.

Last year, global physical gold investment was 1,090 mt versus 3,890 mt for silver. Yes, it's true that physical silver investment demand last year was much less than the 6,090 mt annual average (2009-2018), but silver's price and demand are much more volatile than gold. Physical gold demand is still quite strong and is nearly three times higher than before the 2008 financial crisis. Which means, savvy investors continue to acquire the yellow monetary metal, even though 99% of the world plays in the Grand Global Casino.

That should say something about the strength of the precious physical metals demand with less than 1% of the market participating. What happens to gold and silver demand when the central banks are no longer able to prop up the financial and economic system. Please understand; it's not a matter of "IF," it's a matter of "WHEN."

I believe it's the "WHEN" that is the concern of most precious metals investors. While it's impossible to give a date, logic suggests the timeline is speeding up.

Lastly, I will be publishing several more articles on this subject matter and why gold and silver set themselves apart from the majority of assets. Thus, the future will come down to owning assets that "STORE ECONOMIC ENERGY" versus those that are "ENERGY IOU's."

If you are new to the SRSrocco Report, please consider subscribing to my: SRSrocco Report Youtube Channel.

Check back for new articles and updates at the SRSrocco Report.


To: John Vosilla who wrote (969)3/28/2019 11:11:28 AM
From: RetiredNow1 Recommendation

Recommended By
fred woodall

  Respond to of 1504
 
Time to get cautious....

-------
The Ghost Of 2001

Authored by Sven Henrich via NorthmanTrader.com,

By now you’ve probably read a gazillion opinions on the inverted yield curve and seen a ton of analogs being discussed. On the yield front the general bullish consensus seems to suggest to simply ignore it. Like everything else. On the analog front I see references to examples such as 2016 (the earnings recession will be temporary) and 1994 (the yield inversion is a fake out and it won’t matter) and similar. The general consensus: Ignore the inverted yield curve, buy stocks.

My position remains: More open-mindedness and less certitude. How can anyone actually know what is to be ignored and what isn’t?

I suppose if the argument is simply that central banks are dovish and that is good enough then perhaps that is good enough:

And perhaps it is. I don’t know. It’s worked for 10 years, maybe it will work again.

Maybe central banks can once again render all negatives moot. Yet there are a lot of issues to be mindful of and I listed some of these in Chasing Reality and The Reckoning. The macro wheels are turning.

So an inverted yield curve is bullish and you should buy every dip? Let me at least test this theory by looking at a case a lot less mentioned.

Last year I mentioned the 2000/2001 case quite a bit (see also Imbalance).

What was so interesting about 2000/2001? We had a blow-off top move in tech, markets made a major top, there were multiple 10% moves and an increase in volatility and then something unique happened: A yearly low in December. Sound familiar? It should as the ghost of 2001 is making appearances all over this market.

Back then I said, following this analog, we could see a multi-week rally emerge from the December lows and it did. This one here going even farther than back in 2001.

Let me say upfront here, I’m always cautious with analogs because no situation, economy or market is the same and things always change, hence nothing is like for like.

But in light of the similarities and the now found certitude that an inverted yield curve is something to ignore let’s take a quick peak here how conducive that yield curve inversion then was to buying stocks.

Here’s the current situation:


We had a blast off in January 2018 followed by a 10% correction, a top in September, followed by a 20% correction and now a 21% rally for a, currently, lower high, all the while the yield curve flattening and now resulting in an inversion.

As I said no situation is alike, but here’s how all this played out in 2000-2001:


There was a little fake out inversion following the March 2000 top, but then the inversion really got started in July. Yes there were rallies even in the 2 months following the inversion, but as should be clear markets started trending down following a lower high. The recession officially started in March 2001, or a mere 8 months after the initial inversion and the rest is history as $SPX dropped 50% from its highs and didn’t bottom until late 2002.

In this scenario, where was the inversion of the yield curve bullish for equities? The answer is obvious: It wasn’t bullish for equities. Yes you had rallies, but they were opportunities to sell.

Now I’m the first to say I have no clue how this inversion here plays out. Maybe it’s an initial fake out as in April 2000 and that buys equity markets some more time in chopping around, and perhaps we get some more yield curve optimism as we apparently saw in the summer of 2000. Or maybe it all plays bullish as central banks are now dovish and that’s all there is to it.

All I’m saying is this 2000/2001 scenario is a case of an inversion of the yield curve following a very long business cycle and hyper bull market that was not bullish for stocks at all. I don’t see this being discussed anywhere hence I thought it’s worth pointing out.

And perhaps I’ll finish off with another little nugget here. Don’t forget we are at a point of cyclical low unemployment and, coincidental or not, personal interest payments are rising aggressively. Oddly enough that sudden acceleration in personal interest payments coinciding with a cyclical low in unemployment is precisely what we saw during the end phase of the previous two bull markets:


Aren’t analogs fun to ponder?

Look, nobody has access to the holy grail here, but dismissing the yield curve inversion as a fluke or fake out given the history outlined above is to be in denial about the alternative outcome possibilities, hence my tweet this morning:

The ghost of 2001 is all around us. Can anyone else see it, or am I just victim of an apparition? Either way it’s giving me goosebumps hence I’m keeping an open mind.

* * *

For the latest public analysis please visit NorthmanTrader. To subscribe to our market products please visit Services.


To: John Vosilla who wrote (969)3/28/2019 11:12:39 AM
From: RetiredNow  Respond to of 1504
 
Pending Home Sales Tumble 4.9% YoY - 14th Straight Month Of Declines

With home price growth at the slowest rate since 2012, rates falling, and existing home sales having rebounded notably, pending home sales are expected to slow very modestly in February after rebounding in January, but they fell more than expected.

Pending Home Sales fell 1.0% MoM (against expectations of a 0.5% decline)


Lawrence Yun, NAR chief economist, is (surprise, surprise) optimistic...
  • In January, pending contracts were up close to 5 percent, so this month’s 1 percent drop is not a significant concern,” he said.
  • “As a whole, these numbers indicate that a cyclical low in sales is in the past but activity is not matching the frenzied pace of last spring.”
Yun added that despite the growth in the West, the region’s current sales are well below the sales activity from 2018.
  • “There is a lack of inventory in the West and prices have risen too fast. Job creation in the West is solid, but there is still a desperate need for more home construction.”
Yun pointed to year-over-year increases in active listings from data at realtor.com to illustrate the potential rise in inventory.

Denver-Aurora-Lakewood, Colo., Seattle-Tacoma-Bellevue, Wash., San Diego-Carlsbad, Calif., Portland-Vancouver-Hillsboro, Ore.-Wash., and Nashville-Davidson-Murfreesboro-Franklin, Tenn., saw the largest increase in active listings in February compared to a year ago. Yun added that he does not anticipate any interest rate increases from the Federal Reserve in 2019.
  • “If there is a change at all, I would say the Fed will lower interest rates in 2019 or 2020. That would stimulate the economy and the housing market,” he said.
  • “But the expectation is no change at all in the current monetary policy, which will help mortgage rates stay at attractive levels.”
However, this is the 14th month in a row of annual declines in pending home sales...


This is the longest stretch of declines since 2008.