Clive Maund Gold Market Update
clivemaund.com
By: Clive Maund | April 12, 2020
On the face of it the work of analyzing the markets just got considerably more difficult with the Fed in effect declaring free markets to be a thing of the past. It had been heading in that direction for a long time, but in the past few weeks the Fed crossed the Rubicon, turning the US effectively into a command or State run economy – or more accurately a Central Bank run economy. The Fed’s “prime objective” is to transfer resources from everyone else to the fabled 1%, which it achieves through the means of the creation of endless fiat and inflation, and also to insulate the 1% from loss.
Thus we have the Fed pumping money into Wall St to bid stocks back up, and also taking it upon itself to backstop every aspect of the debt market. The amounts of fiat created for this purpose in recent weeks have been staggering, eclipsing by many orders of magnitude anything done in 2008, which was a “walk in the park” compared to what is going on now.
As discussed in yesterday’s article Welcome to the HYPERINFLATIONARY DEPRESSION one of the core reasons for the nationwide lockdown, using the Covid-19 virus as the excuse, is to pulverize privately owned small businesses across the nation and then absorb their assets, their business and their manpower, both to eliminate competition with larger Fed backed corporations, and to curtail the political independence that goes with private ownership. The economic deep freeze required to bring this about will obviously involve heavy costs, but the Fed has the answer to that which is create still more money with the ultimate being borne by society at large via rampant inflation, once the velocity of money finally picks up again.
Needless to say, the astounding amounts of money being spirited into existence to achieve all this, promise rampant inflation heading in the direction of hyperinflation, which must be bullish for assets having intrinsic value, like gold and silver. It is therefore logical and reasonable to expect a humongous bullmarket in the Precious Metals that will dwarf all previous bullmarkets, which is what the extraordinary extremes in the gold / silver ratio have been promising for a long time. The big challenge for us is to determine how gold and silver will perform over the short to medium-term, until the velocity of money picks up and hyperinflation kicks in, given that the powers that be, knowing the allure of gold and silver for the ordinary investor trying to preserve his wealth, will not pass up any opportunity to put the boot into them whenever they can, which they usually attempt when trading in the metals is light as it switches from Asia to Europe.
Last week many of our technical indicators were pointing to weakness soon in gold and silver, but then the Fed made it plain late in the week that they were going to backstop the entire debt market. This dragged the dollar down and gave the Precious Metals a boost and they closed out the week strong going into the Easter holiday.
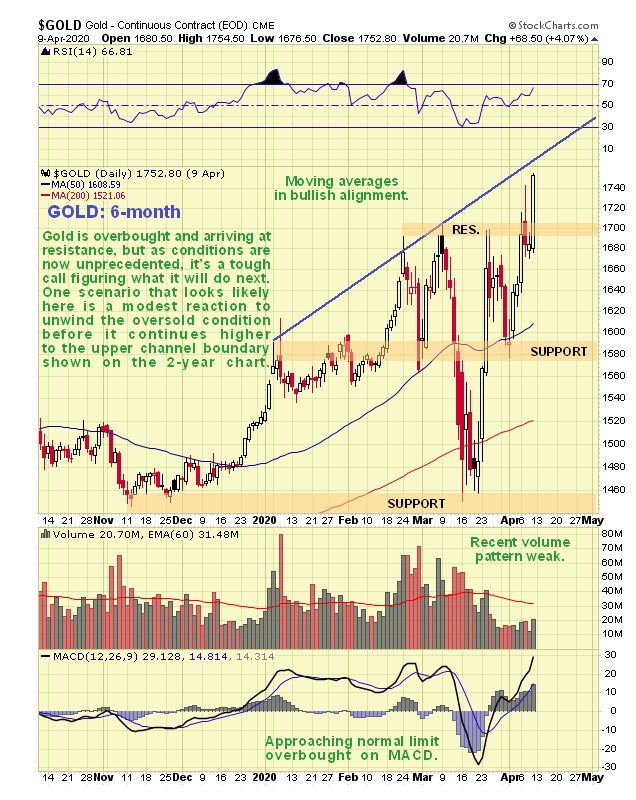
We will start our roundup of the charts as usual with the latest 6-month gold chart on which we see that, after being held in check by resistance near $1700 most of the week, news of the latest Fed profligacy caused it to break clear above this level with a big $68 gain on Thursday. However, the volume profile remains weak, it is getting very overbought now on its MACD and it is approaching a potential trendline target currently at about $1760 - $1765, so, just going on this chart, it could reverse soon, perhaps after a little more upside.
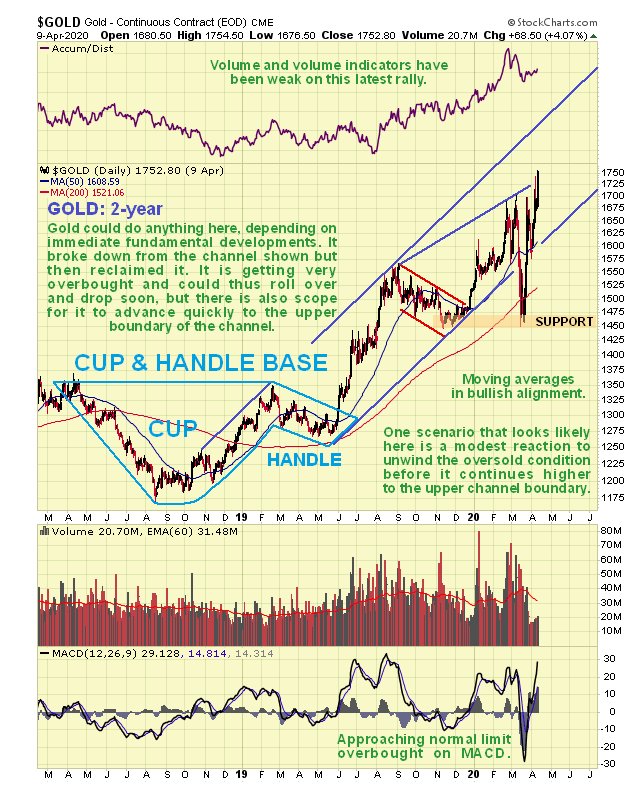
However, the 2-year chart gives us a higher possible target for this move. The reasons for the seemingly bizarre action in gold since early March are actually logical, at least they are viewed in hindsight. In early to mid-March markets were crashing with the specter of a deflationary bust taking gold and silver down too, as happened in 2008 before the bailouts. Then the Fed came riding to the rescue in spectacular fashion, this time making it clear that there were no limits to the funds they are prepared to throw at the markets to goose them higher. Naturally, because of the inflationary implications of this, gold and silver then recovered along with the stockmarkets, despite the fact that the economy is dead with zero velocity of money – for now – to drive inflation up. So what happened is that gold broke down by a big margin from the uptrend in force from early last year, but then climbed all the way back up into it – a most unusual development brought about by most unusual circumstances. Because last week’s extraordinary actions by the Fed promise eventual hyperinflation, the long-term outlook for gold could not be more positive. However, it remains vulnerable to being smashed down again at again until the velocity of money picks up, which will be the prelude to this hyperinflation, which is what makes forecasting its movements over the short to medium-term so tricky. As we can see on this chart, it is now free to make a run at the upper boundary of the uptrend, but as it is already so overbought, one scenario that looks probable is that it pauses here and maybe reacts back some, before then advancing further, although as we have already observed, the 6-month chart suggests that it may have hit a target for now and could go into a deeper reaction. What happens now depends on fundamental developments which is very unpredictable in the current fluid and unstable environment.
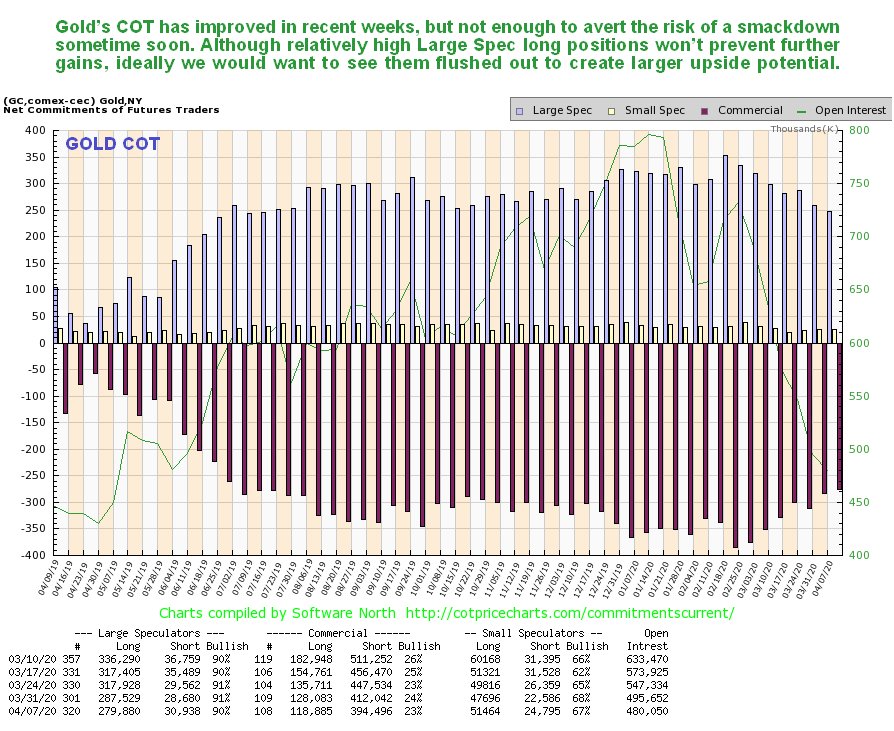
Whilst gold’s latest COT shows continued modest improvement, it also makes clear that it would take a quite heavy drop over the short to medium-term to clean this COT up and flush out the Large Specs and create a better foundation for sustained advance.
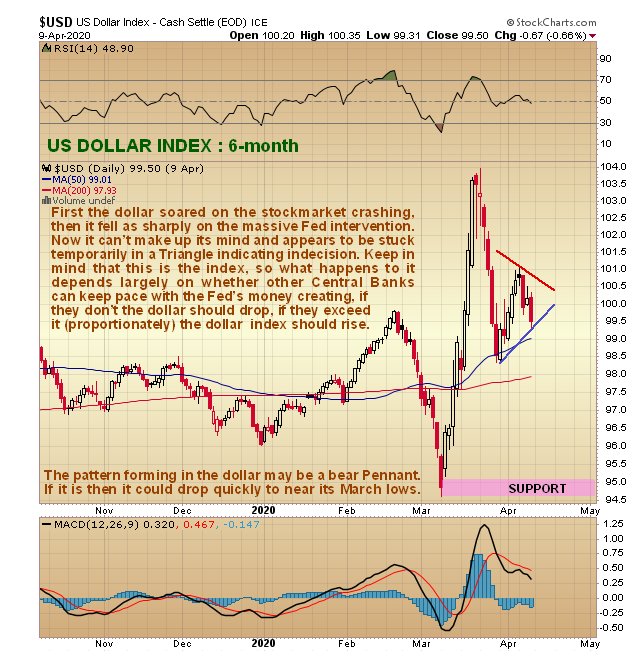
Turning to the 6-month chart for the dollar, we see that after a dramatic spike on the crashing stockmarket, it then plunged back on the heavy Fed intervention, and is now stuck temporarily in a Triangle marking indecision. If anything, this Triangle looks like a bear Pennant which implies another sharp drop soon, and if that happens, gold and silver are going up.
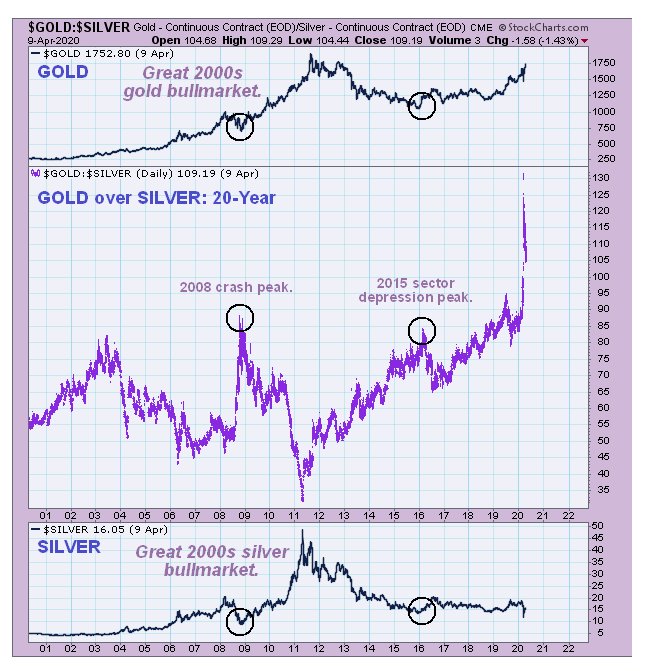
Lastly we will take another look at the long-term chart for the gold / silver ratio, which is at an all-time record, strongly suggesting that a major gold and silver bullmarket is incubating, and as pointed out above, we can expect it to really gain traction when the velocity of money starts to pick up…
 |


