some data to ruminate over later ...
sprott.com
and
cpmgroup.com
How Much Silver Is Above Ground?
By Jan Nieuwenhuijs
Originally posted to Voima Gold.
Above-ground silver stocks are an order of magnitude higher than what is widely assumed.
In total, there were an estimated 1.6 million metric tonnes of physical silver above ground by late 2018. This amount is 20 times higher than what The Silver Institute discloses as “identifiable above-ground stocks,” which is what’s widely assumed to be the total above-ground stock. The huge discrepancy is important to analyze, as it reveals silver’s true stock to flow ratio and supply and demand dynamics. Misunderstanding these dynamics would mean failing to understand the price of silver.
Relatively shortly after humans discovered silver (and gold) thousands of years ago, they started using it as money and a store of value. Accordingly, silver has always been a highly valued monetary metal, and economic agents have been cautious not to waste any. While mining continued throughout the millennia, the total above-ground stock has been ever increasing.
For gold, the consensus is there are about 190,000 metric tonnes above ground, and yearly mine production amounts to 3,260 tonnes (2018). The above-ground stock divided by mine output is called the stock to flow ratio—an important variable for the price formation of commodities—which for gold is 58.
Now, let us have a look at silver. The Silver Institute doesn’t collect its own data but hires the GFMS team at Refinitiv for this purpose. Once a year, The Silver Institute and GFMS publish a report that includes statistics on supply and demand. The most recent report is the World Silver Survey 2019 (covering 2018). On page 37, we can read the following quote, accompanied by a table:
Following nine consecutive annual increases, identifiable above-ground stocks fell 3% year-on-year to 2,549.8 Moz (79,308 t) in 2018.
stock stood at 79,308 tonnes by late 2018. Annual mine production in 2018 was 27,000 tonnes, implying a stock to flow ratio of 3.
However, in the World Silver Survey 2019, we also read:
Jewelry, silverware and other finished fabricated products that are in the possession of end-users are not included in our definition of above-ground refined stocks.
But why is jewelry excluded from the data? Silver jewelry should be included for the same reason gold jewelry is included in the above-ground stock of gold: if the price is right, jewelry can and will be sold into the market. We must conclude that the data from The Silver Institute is incomplete. Additionally, in the World Silver Survey 2019, we find all sorts of supply and demand figures that are not correlated with the price of silver, confirming this data is incomplete.
Strangely, in 1992, The Silver Institute published complete data on above-ground silver, disclosing above-ground volumes to be an order of magnitude higher than current “identifiable above-ground stocks,” but it stopped doing that.
To learn more about the above-ground stock of silver, I reached out to the United States Geological Survey ( USGS). I asked how much silver has been mined throughout history, and how much of that has been lost. They replied 1,740,000 tonnes of silver had been dug up by 2017, of which 7 to 10 % has been lost. Based on their numbers, I’ve computed that 1,616,805 tonnes were still with us by late 2018.
I also found a spreadsheet on the USGS website with silver mining statistics going back to 1900. With the data at my disposal, I could reverse engineer the total above-ground silver stock from 1900 through 2018. See the chart below:
One can argue that because of the use of silver in industrial products since the late 19th century, much of above-ground metal is in industrial products. And I agree. So, how much silver is in bullion, coin, jewelry, and silverware form, and how much is in industrial products?
To find out, I turned to the CPM Group Silver Yearbook 2019. The above-ground volume of silver disclosed by CPM Group is in line with the numbers from USGS. CPM Group estimates that by 2018, there were a little more than 1.7 million tonnes above ground, although to them, it’s unknown how much of that has been lost. Luckily for us, we have an estimate on how much has been lost from USGS.
CPM Group’s breakdown of above-ground silver is shown in the chart below:
Not displayed in the chart above, but CPM Group discloses “inventories” to be roughly 90,000 tonnes, which is more or less what the Silver Institute discloses as “identifiable above-ground stocks.” CPM Group discloses “inventories” to consist of “reported inventories” (exchange vault inventory, ETPs, etc.) and “unreported inventory” (i.e., estimated U.S. depositories and private holdings), and “unreported bullion and coins” (estimates for which they rely on industry sources and historical data).
Most important, we can see in the chart, based on CPM Group’s data, there are nearly 800,000 tonnes of silver in “jewelry, decorative, and religious” forms, and roughly an equal tonnage in industrial products.
Circling back to the question of what the silver stock to flow ratio is, I would suggest it’s somewhere between 30 and 60. If you take all bullion, coins, jewelry, and silverware, you will arrive at 30. If you add the silver in industrial products, you will arrive at 60.
For the ones that are skeptical towards my approach, consider the next quotes from CMP Group, for example on silver jewelry, decorative and religious objects (brackets added to convert ounces into tonnes):
Another [791,000 tonnes] are estimated to exist in jewelry and decorative and religious objects, much of which is recoverable and easily refined into bullion or used directly in various manufacturing applications. These are enormous volumes of a precious metal that has been cherished and held fast throughout history.
Surely, silver jewelry plays an essential part in this metal’s supply and demand dynamics. Another quote by CPM Group on “silver in product form” points out, that when the product turns into waste (or the silver inside the product is worth more than the product), the silver is recycled into, i.e., bullion and coins:
Everyone involved in silver refining and manufacturing of silver products knows that there are continuous unreported flows of silver in product form that are melted and reused directly in new jewelry, decorative objects, and other fabricated products, metal that does not get reported anywhere as silver entering the market. As a result of this flow of unreported metal the amount of silver that exists in bullion and coin form tends to rise over time at a rate that is greater than the amounts captured in estimated newly refined supply and demand.
The silver in industrial products is also part of this metal’s supply and demand—not surprisingly—just like jewelry and silverware.
CPM Group is honest that all their numbers are estimates of a market that is opaque. Their figures are based on their industry sources and their experience in precious metals research since the 1980s.
My conclusion, and the reason I wrote this article, is that silver is a monetary metal with a much higher stock to flow ratio than 3 (as suggested by The Silver Institute). Although it’s difficult to assess an exact stock to flow ratio for silver, it’s at least ten times higher than 3. In my next post, we’ll shift our attention back to gold to discuss gold’s high stock to flow ratio, zoom in on gold’s supply and demand dynamics, and how all this relates to gold’s price formation.
Click Here to view this article on the Voima Gold Website
401krollover.com
World Years Away from Running Out of SilverThe global silver market could face a deficit of 126 million ounces by 2020 and could send silver prices surgingAs the market fixates on the price of oil and other real assets, a dramatic scenario is building in the silver market. More than two billion ounces of silver have disappeared from the market over the last ten years and we could be facing an annual shortage of more than 100 million ounces by 2020.
Not only is demand for silver surging and annual supply growth going nowhere but much of our available silver is being buried in public landfills. As a major component in batteries, CDs, circuit boards and other electronics, people are literally throwing their silver in the trash.
That may be something they soon regret as the world runs out of silver and prices skyrocket.
Silver Demand is Surging and Cannot be StoppedEven as our supply of silver disappears from the market, demand is building every year. Demand for silver is mostly from three important categories; investment, jewelry and industrial uses. These three categories make up 95% of silver demand and they are all growing at a strong rate every year.
Demand for all three major uses of silver have increased over the five years since 2009 but the real story is in the growth in investment and industrial uses. Investors have rushed to silver as central bankers around the world print money to cover spending, destroying the real value of currencies. Demand for silver coins and bars has jumped at an annual pace of 17.5% over the period.
The surge in investor silver demand as a safe haven asset is nothing new. When the U.S. dollar lost more than half its value from 1971 to 1981, the price of silver rose five-fold. Demand of silver coins jumped 63% to a record 65 million ounces in 2008 as the global financial system collapsed. The market meltdown sent silver prices up more than 37% from 2008 through 2010.
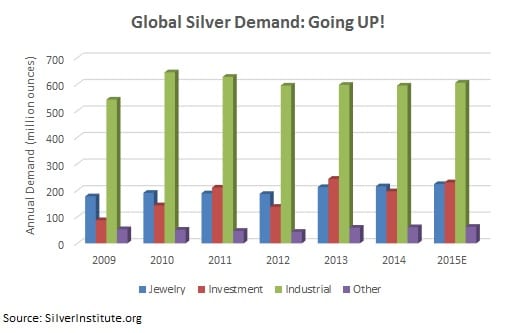
While the annual pace of growth in silver demand for industrial uses has been more modest (1.9%), more than 57% of total demand goes to industrial production. Silver is used in the production process of nearly every industry from electronics to homebuilding and medicine. Demand for silver in photovoltaics for solar energy applications is bounding higher, up 7% in 2014 and up 99% since 2009. Even slower growth in demand amounts to huge additional physical demand, more than 11 million ounces in 2015.
This growing industrial need is an urgent demand. While people may be able to substitute their jewelry demand for silver with another metal and investors may be convinced to sell at higher prices, industrial demand is non-negotiable. The growing need for silver in our industrial progress will not be stopped.
Silver Supply is Shaky and Supply Shocks AboundIn comparison to the rapidly rising demand for silver, especially in investment and industrial uses, the annual supply of silver is much more questionable.
In the past, sales of silver holdings from governments and scrap could fill the gap between higher silver demand and slow growth in mining. The U.S. government alone dumped more than five billion ounces of silver onto the market since World War II to keep prices subdued. The growth in investment demand over the last five years means nobody wants to sell their scrap silver, reducing the annual supply from scrap by 33 million ounces.
The bigger story in the supply picture though is the complete sellout of government holdings. Governments around the world sold 44 million ounces of silver in 2010, supplying more than 4% of the market and keeping the price from rising. Governments have all but sold out of their entire silver holdings and we’ve now lost an important source of supply.
Government silver holdings have fallen 75% to 78 million ounces from over 316 million ounces in 2005. There were no government sales of silver in 2014 and none are expected in 2015 when official numbers are released. Those controlling the remaining government holdings of silver can see the developing deficit in supply and demand as well as anyone. They’re holding on to what little silver stockpile is left for when the silver crisis erupts into higher prices.
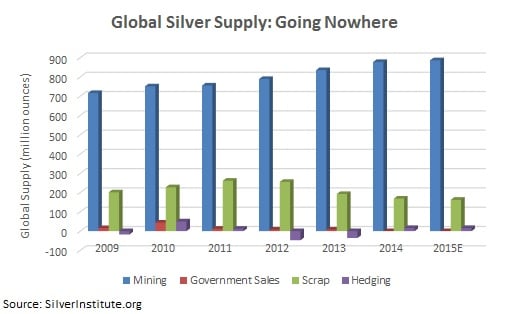
The disappearance of supply from government sales and scrap has put the entire weight of silver supply on mine production…and the outlook for mine production is not good.
As the price of silver and other metals has come down over the past few years, miners have drastically pulled back on their development spending. Near-sighted mining executives have cut hundreds of billions from development plans in order to protect cash flow. This represents the bottom of a cycle that gets repeated every ten years without fail. A mining boom causes production to increase and prices to come down which leads to cuts in development spending. Existing mines are tapped out and fewer new mines are developed, leading to a steep drop in mine production which leads to surging prices.
Not only is the total supply of silver in question but the sources of mining supply are not nearly as stable as you might think. More than 80% of the world’s mining supply of silver comes from just nine countries, seven of which are considered less developed emerging markets.
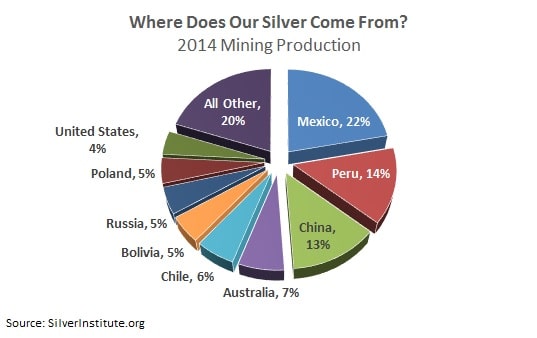
Most of these countries, especially those in Latin America, have been slammed by falling currency values and plunging oil prices over the last year. Besides cutting back on overall development spending, miners are getting out of risky markets like Mexico, Peru and Russia where government resource taxes could be going up to cover budget deficits.
The volatility in mining and employment almost always leads to large scale protests and mine closures as governments fight with mining syndicates over profits. Just the 15 largest silver mines produced 20% of the world’s mining production in 2014, with all but three of the mines in politically risky and unstable countries. Any sudden stoppages in production could seriously affect estimates for silver supply.
Peak Silver and Surging PricesThe silver market is perennially in deficit with demand outstripping supply by millions of ounces. While the annual deficit hasn’t become a full-blown crisis yet, it may not be long before the headlines start inciting panic over shrinking supply.
Silver supply from mining has peaked and the market won’t be able to balance itself with government sales or scrap as it’s done in the past. Investors are already rushing in to buy and hoard their silver in anticipation of higher prices over the next few years.
The silver crisis has already manifested in coin production but is about to get much worse. The U.S. Mint announced in 2010 that it had run out of silver bullion and was forced to suspend production of American Eagle Silver Proof coins.
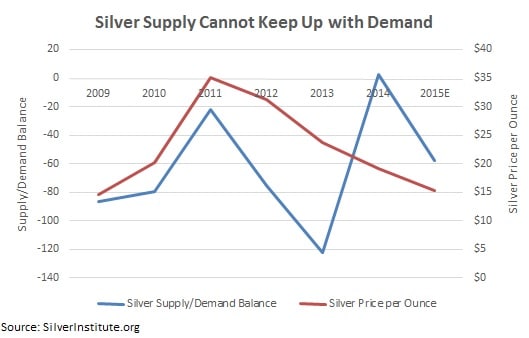
If these trends in silver supply and demand continue, we’ll face a dramatically worsening scenario in just a few years and could run out of silver by 2020. Silver demand is set to increase to 1,466 million ounces by 2020 on its 5-year pace of growth. Even if miners can continue to eke out growth, an unlikely outcome on reduced mine development, the supply of silver is only expected to grow to 1,079 million ounces through 2020.
The above-ground inventory of silver stood at 1,808 million ounces in 2014 but more than 635 million ounces of this was held by exchange traded funds (ETF). Those holdings won’t be available for use as investors will hold onto their silver, guarding it as prices climb higher.
Removing the silver in ETF storage and using available inventory to offset the annual expected deficit between supply and demand, the global market could run out of silver by 2020.
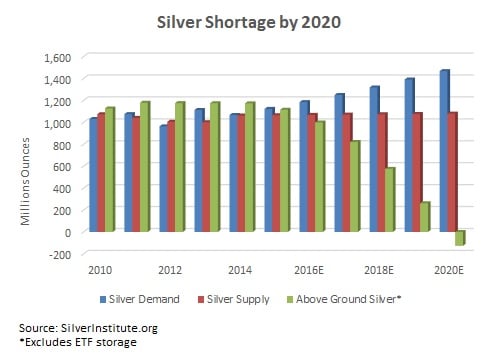
The global silver market could be facing a deficit of 126 million ounces a year by 2020. That deficit will have to be filled somehow. Demand for silver in industrial production is not going to slow down but will look to fill its demand from the only available source besides mining, investors. The growing problem of scarcity will send silver prices surging to convince investors to sell their holdings to industrial users.
The silver shortage will affect nearly every aspect of your life, causing shortages and higher prices in home goods, medicine and industrial products. The only way to protect yourself and even benefit from the coming crisis will be to add silver to your portfolio of safe haven assets now. As the silver crisis develops, holding the metal may evolve from an investment to a necessity for protection against runaway prices and uncertainty.
Most 401k plans restrict your investments to stock funds and bonds, limiting your ability to position for the coming silver crisis. Rolling your 401k plans into an individual retirement account (IRA) allows for greater investment flexibility and puts you in control of your retirement planning. The coming silver shortage means an investor in silver coins and bullion may be one of the best retirement investments you make. |


