more models...,
Another dot on the graphs (Part II)2 FEB 2022 BY GAVIN LEAVE A COMMENT
We have now updated the model-observations comparison page for the 2021 SAT and MSU TMT datasets. Mostly this is just ‘another dot on the graphs’ but we have made a couple of updates of note. First, we have updated the observational products to their latest versions (i.e. HadCRUT5, NOAA-STAR 4.1 etc.), though we are still using NOAA’s GlobalTemp v5 – the Interim version will be available later this year. Secondly, we have added a comparison of the observations to the new CMIP6 model ensemble.
As we’ve discussed previously, the CMIP6 ensemble contains a dozen models (out of ~50) with climate sensitivities that are outside the CMIP5 range, and beyond the very likely constraints from the observations. This suggests that comparisons to the observations should be weighted in some way. One reasonable option is to follow the work of Tokarska et al (2020) and others, and restrict the comparison to those models that have a transient climate response (TCR) that is consistent with observations. The likely range of TCR is 1.4ºC to 2.2ºC according to IPCC AR6, and so we plot both the mean and 95% spread over all all models (1 ensemble member per model) (grey) and the TCR-screened subset (pink).
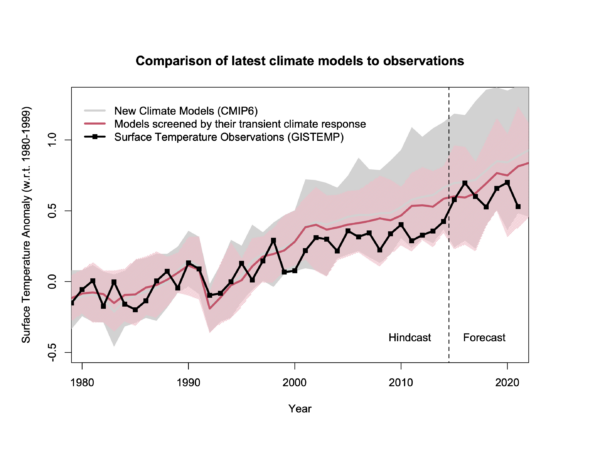 CMIP6 model means and spreads since 1979 (reader friendly version). CMIP6 model means and spreads since 1979 (reader friendly version).
These model simulations have only just been finished, and even though they only used observed boundary conditions (such as GHGs, aerosols, volcanoes and solar activity etc.) up until 2014, and scenarios thereafter (SSP2-4.5 in this figure), it is far too soon to say whether their projections have been validated or not. Additionally, the analysis of these models as an ensemble is only just beginning, and so there may be other methods for looking at this that are more useful.
For the longer term evaluation of this class of climate model, it’s useful to look at the earlier ensembles, such as CMIP3 (which were run almost two decades ago now!). They seem to be doing (surprisingly) well!
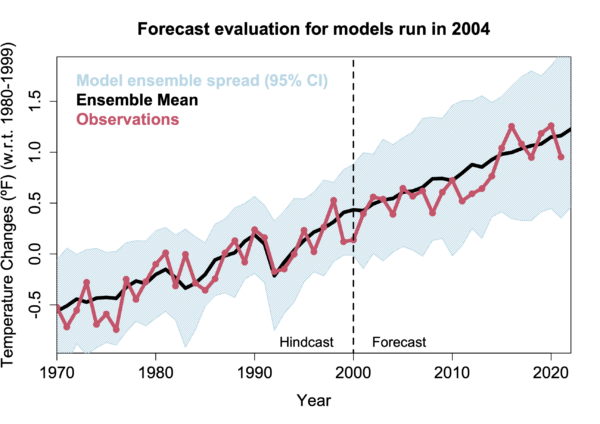 CMIP3 model simulations (historical/SRES A1B) and subsequent observations of surface temperature anomalies (GISTEMP) (reader friendly version). CMIP3 model simulations (historical/SRES A1B) and subsequent observations of surface temperature anomalies (GISTEMP) (reader friendly version).
It’s perhaps important to remember why we maintain this archive. The point is not to claim that models are perfect or can’t be improved. Despite the impressive projections from the CMIP3 models seen above, the match to observations in CMIP6 is much better across a whole suite of important features (e.g. Orbe et al, 2020). However, we frequently see references to claims that models have never predicted anything successfully, or that such comparisons are rigged – frequently accompanied by misleading graphics that play games with the baselines, or hide the observational uncertainty, or don’t compare like-with-like. Our comparisons strive to be fair and since we have maintained them stably for many years, it should be clear that they aren’t being manipulated to adapt to changes in our understanding of the observational record.
In particular, the CMIP5 comparisons to the MSU/AMSU TMT records still show interesting discrepancies which remain a little enigmatic (even if the differences are not as large or as important as some people claim). For instance, it’s still not clear to what extent the specific internal variations of Pacific variability or the impact of inaccurate forcings or the uncertainties in parameterizing deep convection or stratospheric-tropospheric exchange, or further structural issues in the observations, or a combination of all, are responsible. These issues, and how to best to regard the CMIP6 ensemble, will be likely be more thoroughly explored in the coming months and years, and we will be able to tell, hopefully, how skillful the climate models are and hone our expectations for the future.
ReferencesK.B. Tokarska, M.B. Stolpe, S. Sippel, E.M. Fischer, C.J. Smith, F. Lehner, and R. Knutti, "Past warming trend constrains future warming in CMIP6 models", Science Advances, vol. 6, 2020. dx.doi.org. Orbe, L. Van Roekel, ?.F. Adames, A. Dezfuli, J. Fasullo, P.J. Gleckler, J. Lee, W. Li, L. Nazarenko, G.A. Schmidt, K.R. Sperber, and M. Zhao, "Representation of Modes of Variability in Six U.S. Climate Models", Journal of Climate, vol. 33, pp. 7591-7617, 2020. dx.doi.org
realclimate.org |


