GR Silver Announces Significant Updated Mineral Resource Estimate for the Plomosas Project 97 Moz Indicated and 53 Moz Inferred - Silver Equivalent
newswire.ca
GR Silver Mining Ltd. Mar 20, 2023, 06:15 ET
VANCOUVER, BC, March 20, 2023 /CNW/ - GR Silver Mining Ltd. ("GR Silver Mining" or the "Company") (TSXV: GRSL) (OTCQB: GRSLF) (FRANKFURT: GPE) – is pleased to announce an independent, updated Mineral Resource Estimate (the "Resource Estimate") in accordance with National Instrument 43-101 Standards of Disclosure for Mineral Projects ("NI 43-101") for the Company's wholly-owned Plomosas Project in Sinaloa, Mexico. The Resource Estimate was completed by ARSENEAU Consulting Services Inc, ("ACS") of Vancouver, British Columbia, Canada, and integrates resources for the San Marcial, Plomosas Mine and San Juan-La Colorada Areas within the Plomosas Project.
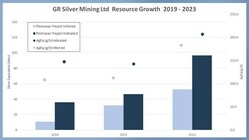
Figure 1 - Resource Growth (CNW Group/GR Silver Mining Ltd.)
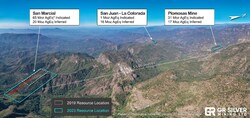
Figure 2 - Location of the Three Areas Integrated in the Pllomosas Project Resource Estimate (CNW Group/GR Silver Mining Ltd.)
Highlights of the Resource Estimate (Table 1) including comparison to the previous mineral resource estimates 1 are:
108% increase in indicated mineral resources from 46 Moz to 97 Moz silver equivalent2 ("AgEq")72% increase in indicated mineral resources from 32 Moz to 55 Moz Ag61% increase in inferred mineral resources from 33 Moz to 53 Moz AgEq20% increase in inferred mineral resources from 18 Moz to 22 Moz Ag44% increase in average indicated mineral resource grade from 143 to 206 g/t AgEq65% increase in average inferred mineral resource grade from 112 to 185 g/t AgEq
San Marcial Area
80% increase in indicated mineral resources from 36 Moz to 65 Moz AgEq65% increase in inferred mineral resources from 12 Moz to 20 Moz AgEqIndicated mineral resources of 9.7 Mt at 209 g/t AgEq (148 g/t Ag)Inferred mineral resources of 3.0 Mt at 200 g/t AgEq (145 g/t Ag)71% of the value of the San Marcial Resource Estimate is comprised of silver91% of the 65 Moz AgEq San Marcial indicated resources are potentially amenable to open pit extractionTrue width of the modelled San Marcial mineralization averages 22 metres, while the SE Area discovery averages 53 metres in thickness, supporting potential for low-cost bulk mineable open pit and/or underground mining methods
____________________
| 1 San Marcial 2019 resource (see News Releases dated February 7, 2019 and June 12, 2020); Plomosas Mine and San Juan 2021 resource (see News Release dated August 23, 2021)
| 2 Refer to footnote below Tables 1 and 2 for AgEq definition
|
Plomosas Mine Area
2022 infill drilling resulted in an increase of 137% in the indicated mineral resource tonnage260% increase in indicated mineral resources from 9 Moz to 31 Moz AgEqAg and AgEq grade increased by 30% and 52%, respectively, in indicated mineral resources in relation to the previous resource estimateAg ounces represent 20% of total indicated mineral resources at the Plomosas Mine AreaAg ounces represent 26% of total inferred mineral resources at the Plomosas Mine AreaTrue width of modelled mineralization at the Plomosas Mine Area averages 20 metres, supporting potential for low-cost bulk mineable open pit and/or underground mining methods46% of the value of the Resource Estimate at the Plomosas Mine Area is comprised of precious metals
Key Statistics
GR Silver Mining has successfully expanded resources at a low cost of exploration and acquisition (US$0.25/oz) at the Plomosas ProjectSince previous resource estimates in 2019 and 2021, the Company has achieved an estimated exploration cost of US$0.17/oz AgEq discoveredIndicated AgEq and Ag ounces have increased 331% and 206% since the Company's inceptionInferred AgEq and Ag ounces have increased 632% and 406% since the Company's inceptionThe proportion of total indicated resource (oz AgEq) has increased since the previous resource estimate, now representing 65% of total resources at the Plomosas Project (Figure 1).Figure 1 Resource Growth
GR Silver Mining Chairman and CEO, Eric Zaunscherb comments, "We are very pleased to achieve this milestone as promised over the past year. The conservative parameters applied, and the approach taken, allow us to be confident in this positive outcome as we focus on broad zones of mineralization that may be amenable to bulk, low-cost open pit and/or underground mining methods. Delivery of this Resource Estimate continues the advance and de-risk process for the Plomosas Project. Management will now turn to planning next steps, which will build on already robust resource growth, tapping into the property's significant exploration potential. Only approximately 300 metres of the SE Area discovery zone has been drilled of 6 kilometres prospective contact strike length,100% controlled by the Company. Recent surface mapping by our geologists has peeled the geological onion and discerned the controls on high-grade mineralization for future success. In addition, we intend to begin attaching economic parameters to the Plomosas Project that, in our opinion, will demonstrate its appeal. We are very proud of, and grateful to, our team of employees and consultants at site for making this possible."
A total of 75 GR Silver Mining drill holes (10,500 metres) were added to the 52 holes used in the previous resource estimate, totalling 122 holes (19,000 metres) for the San Marcial Area including SE Area discovery. At the Plomosas Mine Area, a total of 223 drill holes (16,380 metres) were drilled in specific areas of the existing underground historical mine as part of the infill drilling program. A total of 424 drill holes (60,020 metres) comprises the Plomosas Mine Area database supporting the Resource Estimate.
In addition to the San Marcial and Plomosas Mine Areas, the Resource Estimate also includes the updated mineral resource estimation for the San Juan-La Colorada Area (Figure 2). The Plomosas Project Resource Estimate combines the three areas and includes the SE Area discovery. The Resource Estimate adopts the key parameter of having a reasonable prospect of economic extraction, utilizing a combination of open pit and underground assumptions. Capping was applied to the original assay values prior to compositing in the mineral resource estimation process (Table 4).
A technical report is being prepared on the updated Mineral Resource Estimate in accordance with NI 43-101 and will be available on the Company's website and SEDAR within 45 days of the date of this release. The effective date of the updated Mineral Resource Estimate is March 15, 2023.
Figure 2 Location of the Three Areas Integrated in the Plomosas Project Resource Estimate
The San Marcial Area, including the SE Area discovery, with indicated mineral resources of 9.7 Mt at 209 g/t AgEq (148 g/t Ag) and inferred mineral resources of 3.0 Mt at 200 g/t AgEq (145 g/t Ag) represents approximately 78% of Ag contained in the total Resource Estimate. Shallow infill drilling during 2022 in the 2019 resource area has enhanced the definition of high-grade silver zones close to surface within the San Marcial mineral resource, which is reflected in Table 2, defining the potential for an open pit amenable portion of the San Marcial Area resource estimate.
Infill drilling in the previous resource area of the Plomosas Mine during 2022 has enhanced the definition of silver grades particularly closer to the surface, at shallow levels of the historic underground mine, where the Company achieved better delineation of high-grade Ag zones. At the lower levels of the historic underground mine, the Pb-Zn mineralization continues to provide a strong contribution to the Resource Estimate. Overall, the average silver grades for indicated and inferred resources in the Resource Estimate for the Plomosas Mine Area are slightly higher than the 2021 resource estimate. This is reflected in the detailed summary of the Plomosas Mine Area resource statement in Table 2.
The Resource Estimate for the San Juan-La Colorada Area consists primarily of an update in the geological model and limited drilling to integrate newly interpreted structural controls into the resource estimation. A slight increase in the gold grades can be observed, particularly at La Colorada, resulting from a more detailed modelling, when compared with the previous resource estimate.
Table 1 Plomosas Project Mineral Resource Statement ACS - March 15, 2023
|
|
|
| Average Grade
| Contained Metal
| PLOMOSAS
| Resource
| Type
| Tonnes
| Ag
| Au
| Pb
| Zn
| Cu
| AgEq*
| Ag
| Au
| Pb
| Zn
| Cu
| AgEq
| PROJECT
| Category
| Mt
| g/t
| g/t
| %
| %
| %
| g/t
| Moz
| Koz
| Kt
| Kt
| Kt
| Moz
|
| Indicated
| OP
| 11
| 138
| 0.07
| 0.3
| 0.4
| 0.01
| 203
| 47
| 22.9
| 31
| 43
| 1
| 69
|
| Inferred
| OP
| 3
| 105
| 0.13
| 0.4
| 0.5
| 0.02
| 172
| 9
| 10.7
| 11
| 13
| 1
| 15
|
| Indicated
| UG
| 4
| 62
| 0.48
| 0.8
| 1.2
| 0.06
| 213
| 8
| 61.6
| 33
| 47
| 3
| 28
|
| Inferred
| UG
| 6
| 67
| 0.49
| 0.8
| 1.2
| 0.04
| 191
| 13
| 97.4
| 53
| 78
| 2
| 38
| TOTALS
| Total
| Indicated
| 15
| 117
| 0.18
| 0.4
| 0.6
| 0.03
| 206
| 55
| 84.5
| 64
| 90
| 4
| 97
|
| Total
| Inferred
| 9
| 78
| 0.38
| 0.7
| 1.0
| 0.03
| 185
| 22
| 108.1
| 64
| 91
| 3
| 53
|
Table 2 Plomosas Project Mineral Resource Statement ACS - March 15, 2023 – By Area
|
|
|
| Average Grade
| Contained Metal
| PLOMOSAS
| Resource
| Type
| Tonnes
| Ag
| Au
| Pb
| Zn
| Cu
| AgEq*
| Ag
| Au
| Pb
| Zn
| Cu
| AgEq
| PROJECT
| Category
| Mt
| g/t
| g/t
| %
| %
| %
| g/t
| Moz
| Koz
| Kt
| Kt
| Kt
| Moz
| San Marcial Area
| Indicated
| OP
| 9
| 146
| 0.04
| 0.2
| 0.3
| -
| 205
| 42
| 10.2
| 16
| 28
| -
| 59
|
| Inferred
| OP
| 2
| 127
| 0.03
| 0.1
| 0.2
| -
| 173
| 6
| 1.4
| 1
| 3
| -
| 9
|
| Indicated
| UG
| 1
| 176
| 0.06
| 0.3
| 0.6
| -
| 258
| 4
| 1.5
| 2
| 4
| -
| 6
|
| Inferred
| UG
| 1
| 164
| 0.03
| 0.2
| 0.4
| -
| 229
| 8
| 1.6
| 3
| 5
| -
| 11
|
| Total
| Indicated
| 10
| 148
| 0.04
| 0.2
| 0.3
| -
| 209
| 46
| 11.7
| 18
| 33
| -
| 65
|
| Total
| Inferred
| 3
| 145
| 0.03
| 0.1
| 0.3
| -
| 200
| 14
| 3.0
| 4
| 8
| -
| 20
| Plomosas Mine Area
| Indicated
| OP
| 2
| 93
| 0.24
| 1.0
| 0.9
| 0.07
| 193
| 5
| 11.9
| 16
| 14
| 1
| 10
|
| Inferred
| OP
| 1
| 66
| 0.28
| 1.0
| 1.0
| 0.06
| 174
| 2
| 7.8
| 9
| 9
| 1
| 5
|
| Indicated
| UG
| 3
| 35
| 0.57
| 0.9
| 1.3
| 0.08
| 204
| 4
| 58.0
| 30
| 42
| 3
| 21
|
| Inferred
| UG
| 2
| 38
| 0.57
| 0.9
| 1.1
| 0.06
| 175
| 3
| 39.4
| 20
| 23
| 1
| 12
|
| Total
| Indicated
| 5
| 54
| 0.46
| 1.0
| 1.2
| 0.08
| 200
| 8
| 69.9
| 46
| 56
| 4
| 31
|
| Total
| Inferred
| 3
| 46
| 0.48
| 0.9
| 1.0
| 0.06
| 175
| 5
| 47.2
| 28
| 32
| 2
| 17
| San Juan-La Colorada Area
| Indicated
| OP
| 0.1
| 161
| 0.29
| 0.3
| 0.6
| 0.02
| 211
| 0.4
| 0.8
| 0
| 1
| -
| 1
|
| Inferred
| OP
| 0.2
| 104
| 0.24
| 0.5
| 0.8
| 0.02
| 158
| 0.7
| 1.5
| 1
| 2
| -
| 1
|
| Indicated
| UG
| 0.1
| 90
| 0.61
| 1.1
| 0.8
| 0.04
| 198
| 0.3
| 2.1
| 1
| 1
| -
| 1
|
| Inferred
| UG
| 2.6
| 33
| 0.69
| 1.2
| 1.9
| 0.04
| 182
| 2.8
| 56.4
| 31
| 49
| 1
| 15
|
| Total
| Indicated
| 0.2
| 121
| 0.46
| 0.7
| 0.7
| 0.03
| 204
| 0.8
| 2.9
| 1
| 1
| -
| 1
|
| Total
| Inferred
| 2.8
| 39
| 0.65
| 1.1
| 1.8
| 0.04
| 180
| 3.5
| 57.9
| 32
| 51
| 1
| 16
|
| Numbers are rounded
| * AgEq = calculated from the metal prices and recoveries using the equation AgEq = ((Au price*Au Recovery) + (Ag Price*Ag Recovery) + (Pb Price*Pb Recovery) + (Cu Price*Cu Recovery) + (Zn Price*Zn Recovery)) / (Ag Price*Ag Recovery)
| (1) Mineral Resources which are not Mineral Reserves, do not have demonstrated economic viability
| (2) The estimate of Mineral Resources may be materially affected by environmental, permitting, legal, title, taxation, socio-political, marketing, or other relevant issues
| (3) The Inferred Mineral Resource in this estimate has a lower level of confidence than that applied to an Indicated Mineral Resource and must not be converted to a Mineral Reserve. It is reasonably expected that the majority of the Inferred Mineral Resource could be upgraded to an Indicated Mineral Resource with continued exploration
| (4) The Mineral Resources were estimated using the Canadian Institute of Mining, Metallurgy and Petroleum (CIM), CIM Standards on Mineral Resources and Reserves, Definitions and Guidelines prepared by the CIM Standing Committee on Reserve Definitions and adopted by the CIM Council
|
|
Mineral Resource Estimates
The mineral resource estimates for the San Marcial, Plomosas Mine, San Juan-La Colorada Areas were provided by Dr. Gilles Arseneau, P.Geo. of ARSENEAU Consulting Services Inc. (ACS) using Geovia Gems Version 6.8.4. The San Marcial and Plomosas Mine mineral resources were estimated by ordinary kriging, and the San Juan-La Colorada mineral resources were estimated by the Inverse Distance Squared method. The Plomosas and San Juan models were estimated in 5 metre cube blocks and the San Marcial grades were estimated in 10 by 5 by 10 metre blocks. Grades were capped to the 98th or 99th percentile from probability plots prior to compositing to 1 metre. Block grades were estimated in three successive passes for the San Marcial and Plomosas Mine and four passes for the San Juan-La Colorada Area. The historical Grupo Mexico drill holes were only used for passes two and three at the Plomosas Mine and for passes three and four at the San Juan-La Colorada Area. Blocks estimated with Grupo Mexico drill holes were all classified as inferred mineral resources. Blocks estimated during Pass 1 with at least two drill holes or Pass 2 at San Juan, with at least four drill holes, were classified as Indicated.
Mineral resources are reported using a dollar equivalent based on the following metal prices and recoveries determined from recent metallurgical tests. The mineral resources are reported using pit constrained ("Whittle Pit Assessment") and Underground stope optimizer ("MSO") with operational cost assumptions reported in Table 3.
Table 3 Summary Parameters Adopted for Resource Estimation and Mineral Resource Reporting - Plomosas Mine and San Juan Areas
Plomosas Project
| Metal Prices
| Gold US$/oz
| $1,750
| Silver US$/oz
| $22.00
| Lead US$/lb
| $1.10
| Zinc US$/lb
| $1.30
| Copper US$/lb
| $4.20
| Area
| San Marcial
| Plomosas Mine
| San Juan
| Metallurgical Recoveries***
| Gold
| 0
| 86 %
| 79 %
| Silver
| 94 %
| 74 %
| 71 %
| Lead
| 59 %
| 69 %
| 58 %
| Zinc
| 80 %
| 75 %
| 47 %
| Preliminary Cost Assumptions
Mineral Resource Reporting****
| Open Pit ("OP")
| 30 US$/t
| 30 US$/t
| 30 US$/t
| Underground ("UG")
| 60 US$/t
| 60 US$/t
| 60 US$/t
|
| *** Based on preliminary metallurgical testwork completed in 2021 with samples from both areas investigating potential production of precious metal-rich concentrate
| **** Preliminary cost assumptions adopted in the Whittle assessment and MSO are based on similar type deposits in Mexico where underground and open pit operations are in progress for a throughput capacity of 1000 tpd
|
|
Capping was adopted in the Resource Estimate by each specific domain as indicated in Table 4.
The reasonable prospect of economic extraction was defined by generating a Whittle optimized pit shell based on the above metal prices and recoveries and assuming a total open pit mining cost and processing cost of US$30/t. Underground resources were restricted to shapes defined by stope optimizer software and assumed combined underground mining and processing costs of US$60/t.
The mineral resource estimates are based upon drilling completed by the Company between 2021 and 2022.
Table 4 Plomosas Project – Assay Capping Level by Area
Metal
| San Marcial
Silver Zone
| San Marcial
Pb-Zn Zone
| Plomosas
US$20 Zone (DDH)3
| Plomosas
Pb-Zn Zone (DDH)
| San Juan
| La Colorada
| Gold
| NC
| NC
| 15.0 g/t
| 2.5 g/t
| 3.0 g/t
| 5.0 g/t
| Silver
| 1,800 g/t
| 850 g/t
| 800 g/t
| 200 g/t
| 825 g/t
| 350 g/t
| Copper
| NC
| NC
| 1.0 %
| 1.0 %
| NC
| 0.5
| Lead
| 4.5 %
| 4.5 %
| 20.0 %
| 6.5 %
| 4.0 %
| 10.0 %
| Zinc
| 5.0 %
| 5.0 %
| 15.0 %
| 8.3 %
| 8.0 %
| 13.0 %
|
| 3DDH = drill holes
| NC=no capping applied
|
|
QA/QC Procedures
The Company has implemented QA/QC procedures which include insertion of blank, duplicate and standard samples in all sample lots sent to SGS de México, S.A. de C.V. laboratory facilities in Durango, Mexico, for sample preparation and assaying. For every sample with results above Ag >100 ppm (over limits), these samples are submitted directly by SGS de Mexico to SGS Canada Inc. at Burnaby, BC. The analytical methods are four acid Digest and Inductively Coupled Plasma Optical Emission Spectrometry with Lead Fusion Fire Assay with gravimetric finish for silver above over limits. For gold assays the analytical methods are Lead Fusion and Atomic Absorption Spectrometry Lead Fusion Fire Assay and gravimetric finish for gold above over limits (>10 ppm).
Qualified Person
The mineral resource estimate was completed by independent consultant Dr Gilles Arseneau, P. Geo. of ARSENEAU Consulting Services Inc., a registered professional, who is an independent Qualified Person (QP) as defined by NI 43-101. Mineral resources are reported in accordance with CIM (2014) Definition Standards for Mineral Resources and Mineral Reserves in accordance with NI 43-101. Dr. Arseneau is a P. Geo. and is qualified as a Mineral Resource estimator and has over 25 years of relevant industry experience.
The scientific and technical data contained in this News Release related to the Plomosas Project was reviewed and/or prepared under the supervision of Marcio Fonseca, P. Geo. He has approved the disclosure herein.
About GR Silver Mining Ltd.
GR Silver Mining is a Canadian-based, Mexico-focused junior mineral exploration company engaged in cost-effective silver-gold resource expansion on its 100%-owned assets, located on the eastern edge of the Rosario Mining District, in the southeast of Sinaloa State, Mexico. GR Silver Mining controls 100% of two past producer precious metal underground and open pit mines, within the expanded Plomosas Project, which includes the integrated San Marcial Area and La Trinidad acquisition. In conjunction with a portfolio of early to advanced stage exploration targets, the Company holds 734 square kilometres of concessions containing several structural corridors totaling over 75 kilometres in strike length.
GR Silver Mining Ltd.
Eric Zaunscherb, Chairman & CEO
Cautionary Statement Regarding Forward-Looking Information
This press release contains "forward-looking statements" within the meaning of applicable Canadian securities legislation and information that are based on the beliefs of management and reflect the Company's current expectations. When used in this press release, the words "estimate", "project", "belief", "anticipate", "intend", "expect", "plan", "predict", "may" or "should" and the negative of these words or such variations thereon or comparable terminology are intended to identify forward-looking statements and information. Such statements and information reflect the current view of the Company. Risks and uncertainties may cause actual results to differ materially from those contemplated in those forward-looking statements and information. By their nature, forward-looking statements involve known and unknown risks, uncertainties and other factors which may cause our actual results, performance or achievements, or other future events, to be materially different from any future results, performance or achievements expressed or implied by such forward-looking statements.
Neither the TSX Venture Exchange nor its Regulation Services Provider (as that term is defined in the policies of the TSX Venture Exchange) accepts responsibility for the adequacy or accuracy of this press release.
SOURCE GR Silver Mining Ltd.
 For further information: Brenda Dayton, VP Corporate Communications, Telephone: +1.604.417.7952, Email: bdayton@grsilvermining.com For further information: Brenda Dayton, VP Corporate Communications, Telephone: +1.604.417.7952, Email: bdayton@grsilvermining.com
|


