from behind the paywall, and as you read you might begin to appreciate the significance of Albert's insight and what ZeroHedge folks makes of Albert's insight, that somehow the Trump, many times bankrupt, might not do the right thing as one term president and print print print ...
Either this time is different, or the US might just be slip-sliding into a profits crushing recession, and this time - thanks to Trump and Musk's DOGE - there will be no $1 trillion in debt in 100 days to pull the US economy out of the abyss... ... which means, spoiler, we GetMoreGold.
zerohedge.com
Albert Edwards: This Is The Most Insane Chart Of The Year
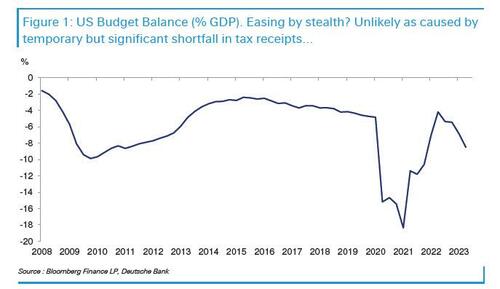
Well over a year ago, in the summer of 2023, we first pointed out that Biden's explosive budget deficit was on giant economic "stealth stimulus" amounting to $1 trillion or more, and was responsible not only for the remarkably stable US economic growth, but also for the unprecedented ability of the US to delay its long overdue slide into a recession. In short, Bidenomics was nothing than one endless diarrhea of debt (one which has since pushed total US debt to over $36 trillion and was instrumental in Trump's Nov 5 victory).
Curiously, even though the dementia-ridden Biden is now one foot out the door (in every sense of the word) as the trillions in debt he incurred to create the impression the US was doing great will stay with us until they get inflated away, and even though we did our best to expose the fake facade of Bidenomics, some still find it shocking how the outgoing president managed to fool so many for so long.
One among them is SocGen's Albert Edwards, who in his latest strategy weekly note takes a fresh look at the basis for recent US "exceptionalism" (which in light of the above preamble should be familiar to regular ZH readers) and culminate with what he calls the "most bonkers chart of 2024."
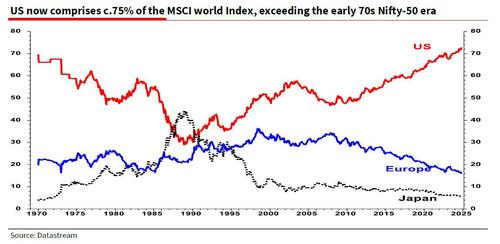
Starting at the top, the SocGen bear writes that there has been much commentary recently on the extent of the US stock market ‘bubble’, especially now the US equity market’s share of world market capitalization has hit an extraordinary 75% (more in Edwards' last GSW report, available to pro subs).
Picking up from that observation, Edwards pivots to a recent FT Opinion article this month titled The mother of all bubbles: The US has never been so overhyped, relative to the rest of the world, and which can be visualized in the following recent chart from BofA's Michael Hartnett showing US "exceptionalism" vs their European peers.
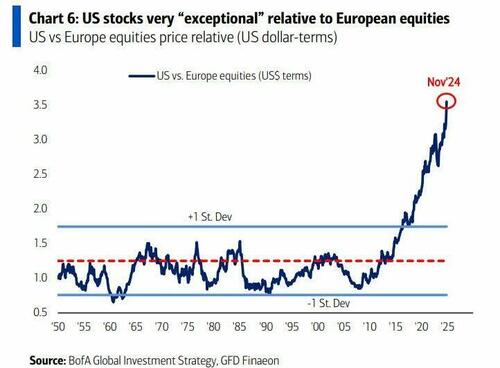
To quote the op-ed author, former Morgan Stanley banker Ruchir Sharma, “This is not a bubble in US markets, it’s mania in global markets. At the height of the dotcom bubble in 2000, US stocks were more expensively valued than they are now. But the US market did not trade at nearly so vast a premium to the rest of the world. Nor is this just AI mania by a new name. On indices that weight stocks equally regardless of size and correct for the domination of Big Tech, the US has outperformed the rest of the world by more than four to one since 2009.”
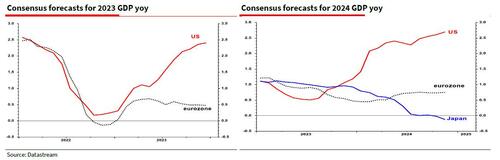
But as Shama caveats “some of the premium is rational. Compared to Europe and Japan, the US economy is growing faster.”
Simple enough: and indeed seen in this light, "it is easy to rationalize the US valuation excess" and we all know the arguments because we hear and read them almost every day. In essence, the argument is that US stocks deserve a huge premium because profits are growing much faster in the US than in any another major economy, a trend likely to continue given its dominance in tech related companies.
That makes some sense, Edwards concedes, "even to a bear like me!"
But - because there is always a but - the question then becomes what is the source of this tremendous profit growth. And this is where Edwards figures out what we first noted in July 2023, namely that the US government deficit since Covid has remained super expansionary at around 7.5% of GDP in 2023, 2024 and forecast for 2025. This compares to the eurozone and even Japan (for example) with deficits of ‘only’ 3% of GDP. That’s a staggering gap amounting to trillions of dollars, most of which flow straight through to company profits!
And here the SocGen permabear echoes what we said last summer, noting that "many investors widely under-appreciate how crucial US fiscal dysentery is as the propellant of far superior US profits growth which in turn ‘justifies’ far higher equity market valuations."
Well, not those who read our explanation for why said "fiscal dysentery" was confused with the "success" of Bidenomics and the flood of US "profits." But for everyone else, the SG strategist notes that "it will be much "sexier" to latch onto a story around US corporate exceptionalism in tech."
Alas, there is always more than meets the eye when it comes to US exceptionaism, and "understanding the true (fiscal) source of US corporate superior profits growth gives us a handle on figuring out just how sustainable the US equity bubble is."
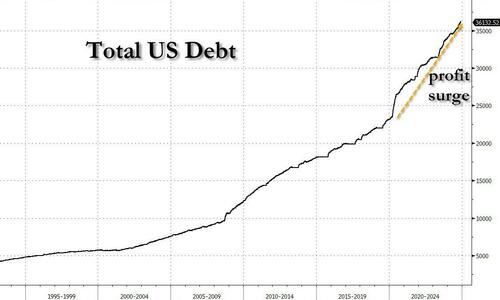
Which brings us to what Albert calls the "most bonkers chart of 2024": the post-covid explosion of corporate profitability...
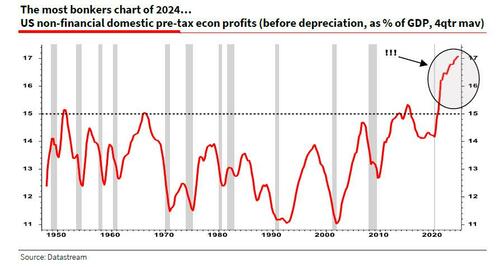
... which took off just as US debt exploded. Coincidence?
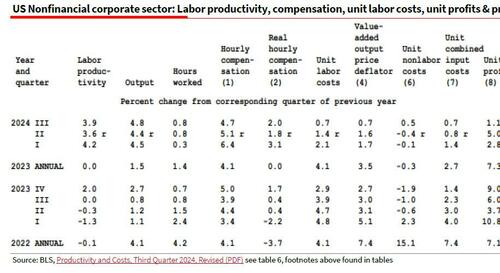
There's more: the latest estimates of US productivity and labor costs just published by the US Bureau of Labor Statistics further emphasize the extraordinary performance of US profitability. Edwards notes that the report shows a substantial downward revision to unit labor costs for both the non-farm business sector (chart below) and its subset, non-financial corporate businesses (see table below and BLS report here).
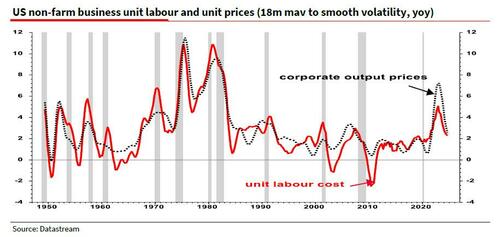
The chart above demonstrates the unusual recent "greedflation" phenomenon where corporate prices rose much faster than unit labour costs (ULC), and where the difference we now know was funded with excess debt. Despite the rapid wage growth, Albert notes that unit labor costs were held down by gangbusters productivity growth which rose this year at a stunning 4% yoy, causing unit profit margins to continue to expand even higher (see table below).
Putting it all together, and as shown again in the Kalecki chart below, the US profits boom has at its origin US fiscal profligacy, where s burst of private sector saving was funded by the government deficit:
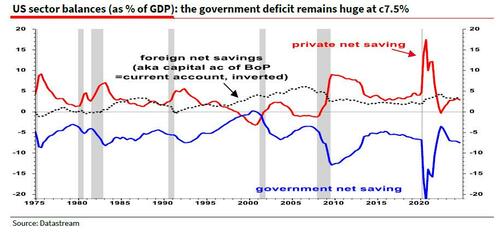
The idea is simple: if one sector of the economy (say government) is a borrower then other sectors must be lending. Hence the national income identity equation below shows how sector net savings must sum to zero.
Corporate Saving + Household Saving + Government Saving + Foreign Saving = 0
In the chart above you can clearly visualize how the private sector (household + corporates) and the capital account surplus on the Balance of Payments together fund the huge government deficit. It is simple stuff. Rearranging the above equation, we get to the Kalecki-Levy equation.
Corporate profits – Investment – Dividends = 0 – Household Saving – Government Saving – Foreign Saving
Profits = Investment + Dividends – Household Saving – Foreign Saving – Government Saving
So while stock pickers might be seduced by the siren micro stories of the Magnificent 7 and more recently AI and ChatGPT to justify superior US profits, Edwards instead urges to look at the Kalecki-Levy equation and simply attribute the corporate profits boom to fiscal profligacy. Indeed, the US GDP upside surprises in both 2023 and this year have the same explanation, something we have pounded the table on for the past several years.
What could go wrong? Edwards here suggests that one big risk is that the positive impact of Biden's generous fiscal largesse on the economy (and profits) is diminishing. We once again highlight the simple chart below which has predicted recessions with 100% accuracy.
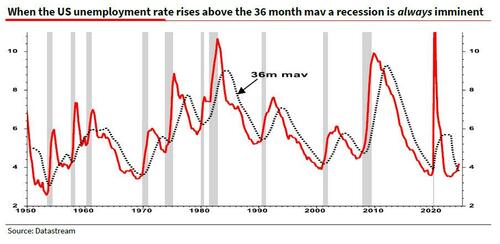
Six times we see the 36-month moving average of unemployment falling before the recession (i.e. excluding the July 1981 recession which quickly followed the Jan 1980 recession). And then when the unemployment rate cuts above the 36m mav, the NBER dates the start of the recession at that very month in five out of six cases (Nov 1973 was the exception at 6 months delay).
Be alert: a recessionary crossover occurred in May 2024 but to add to the caution, the 36m mav (dotted line) just started rising too in November, which usually only ever happens deep into a recession.
Either this time is different, or the US might just be slip-sliding into a profits crushing recession, and this time - thanks to Trump and Musk's DOGE - there will be no $1 trillion in debt in 100 days to pull the US economy out of the abyss... |


