re <<ok>>
looking bullish
The bottom line: to get gold to an average of $3,000/oz this year, investment demand needs to increase by just 1%. For gold to hit $3,500/oz, investment demand needs to rise by 10%. That’s a lot, but not impossible.
Indeed, to pick just one supportive dynamic, China’s Financial Supervision Administration has decided to launch a pilot program for insurance funds to invest in gold spot contracts, gold spot deferred delivery contracts, Shanghai gold centralized pricing contracts, gold price inquiry spot contracts, gold price inquiry swap contracts and gold leasing business listed or traded on the main board of the Shanghai Gold Exchange.
Our China insurance team estimates that China’s insurers have invested a total of RMB32tn, or USD4.4tn, so in keeping with the pilot’s outline (investment in gold shall not exceed 1% of the company's total assets at the end of the previous quarter), the potential inflows into gold could be in the region of RMB180-200bn, or USD25-28bn. Our colleagues also expect that companies will purchase gold actively and use their allowance within a year because insurers face declining investment returns in a low interest rate environment, while gold is regarded as a good long-term asset to hold. Putting concrete numbers behind this, the purchases could generate around 300 tonnes of gold purchases or 6.5% of the annual physical market.
zerohedge.com
As Gold Heads For $3000, BofA Digs Into Intensifying Market Dislocations
BY TYLER DURDEN
THURSDAY, FEB 13, 2025 - 04:00 AM
Bank of America has been bullish gold for the best part of two years and first published their $3,000/oz price target in June 2024, which places them in the perfect spot to explain the nuances of the current and intensifying market dislocations occurring with the precious metals trading environment.
Since their initial bullish forecast, gold has posted a series of record highs and they remain constructive. That said, the action has not been just in flat prices; other segments of the market have also seen significant volatility.
This is reflected in Exhibit 1 and Exhibit 2 below, which show sharp increases in lease rates and exchange for physicals.
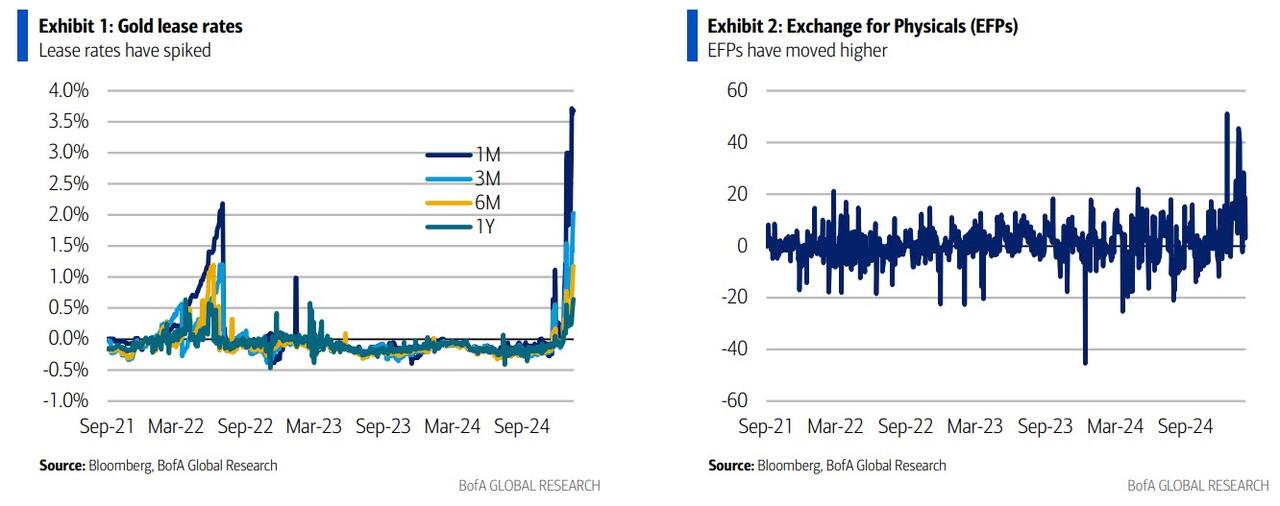
What have those moves been about?
Gold trades at different venues Gold is traded at different venues and the London over-the-counter market is usually the main marketplace (Exhibit 3), although there are also derivatives exchanges and secondary marketplaces.
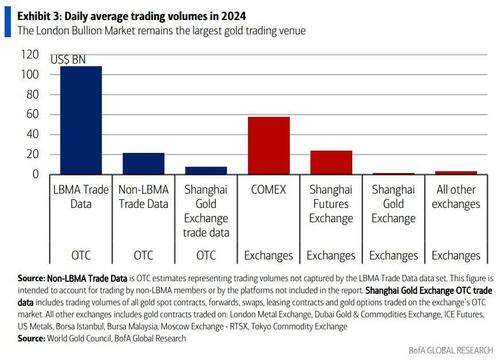
The London OTC market has long been the centre of gold trading and today comprises approximately 70% of global notional trading volume, according to the World Gold Council. The London market is regulated by the London Bullion Market Association and trades 400 ounce “Good Delivery” bars, which are stored in member vaults of the London Precious Metals Clearing Limited (LPMCL) and the Bank of England. Beyond setting spot reference prices, London also makes a forward market, with the London Bullion Market Association in the past publishing gold forward rates (GOFO), although that was suspended in 2015. Interbank forward gold swap rates (more on this below) have taken over the GOFO function.
The decision to stop publishing GOFO was accompanied by the evolution of derivatives exchanges. Indeed, the CME’s COMEX division has become an increasingly important venue in the price discovery process. Trading activity on COMEX is primarily concentrated on the ‘active month’ (nearest dated) contract, which acts as a proxy for the spot price. It’s worth noting that even if the CME’s contracts are physically settled, only a small number make it to maturity, accompanied by physical delivery or removal of bars into and out of COMEX vaults.
In China, Shanghai Gold Exchange and Shanghai Futures Exchange have become important. Shanghai Gold Exchange, established in 2002 under oversight of the People’s Bank of China, is a spot and deferred contracts trading venue, which is complemented by futures trading on Shanghai Futures Exchange. Beyond that, the World Gold Council also notes1 a range of secondary trading centres in Dubai, India, Japan, Singapore and Hong Kong. Exchanges in all these markets offer a range of spot trading facilities or listed contracts but they have not attracted the liquidity seen on the market’s primary venues.
Nonetheless, these markets play an important role to varying degrees in serving local demand or acting as regional trading hubs.
Trading opportunities as gold is quoted at different OTC and exchange venues While spot gold prices remain the market focus, the different venues and tenors/ maturities of contracts mean that trading the yellow metal is multi-faceted.
Gold forward offered rate, swaps and the futures curve
Gold forwards work essentially like futures, the main difference being that they are not traded in organized markets, so they are over-the-counter (OTC). Hence, forwards carry a credit risk but, in turn, they are not standardized contracts, and are customized to meet investors’ particular needs. This also means that forwards often command a premium for the privilege of customization. Therefore, a gold forward contract is a transaction in which two parties bilaterally agree on the purchase and sale of gold at a future date. The majority of gold forwards are traded in the London gold market.
Taking gold forwards a step further, swaps are OTC contracts that exchange financial instruments. Swaps involve cash flows based on a notional principal amount. In the precious metals space, they are effectively a gold-collateralised loan, i.e. gold is borrowed (lent) against a currency, so in these transactions gold is exchanged for USD: market participants purchase bullion at spot, while selling the metal forward (from the borrower’s perspective), or they sell the metal at spot and buy the bullion forward (from the lender’s perspective). Gold forward swap rates can be thought of as gold-to-US dollar exchange rate.
Meanwhile, the CME gold futures curve plots gold prices across different maturities. The contracts are standardised to 100oz and physically settled.
Exhibit 4 and Exhibit 5 pick up on this, showing the OTC gold forward swap rates and exchange-traded CME gold futures. Notably, OTC forward swap rates have collapsed, while gold futures remain in a relatively steady contango...
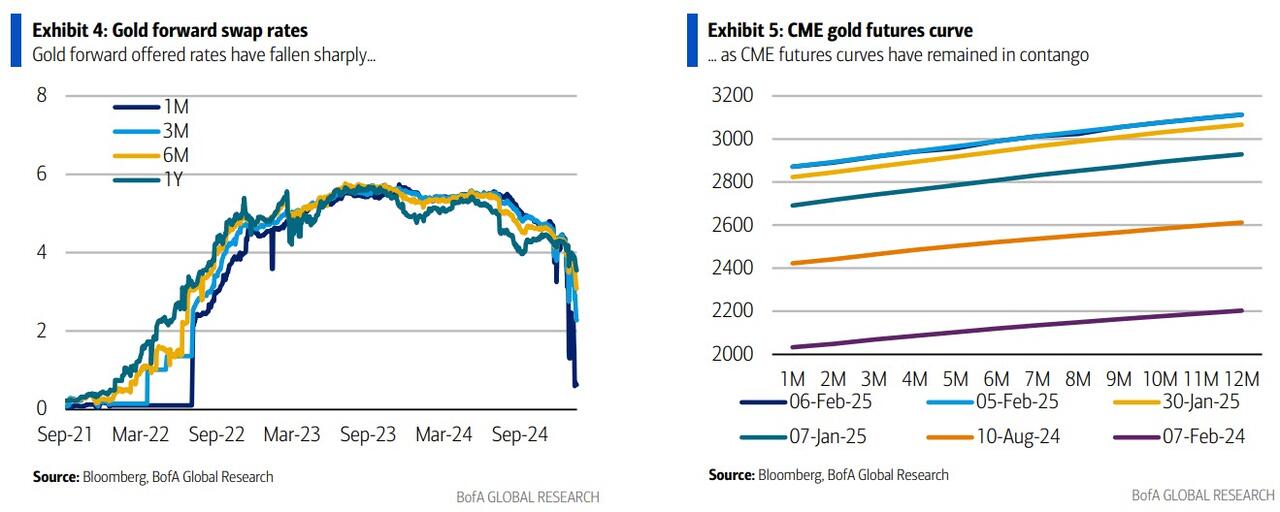
Sticking with the shape of the forward/futures pricing curves, backwardations in the gold market are rare because gold is usually not lost, i.e. most of the gold that has historically been mined still sits somewhere in above-ground stocks. That said, curve shapes can shift, as the collapse in the forwards highlights (we will discuss that later).
Gold lease rate The gold lease rate (GLR) is the cost to borrow gold, expressed as an interest rate. The lease rate can be thought of as a transaction where a gold owner sells the gold and simultaneously buys it back further out. The proceeds can then be invested in USD, so they earn interest, and Secured Overnight Financing Rate (SOFR) is typically the reference. Hence, in keeping with an arbitrage-free market, the lease rate is the difference between SOFR and the OTC gold forward swap rate. A higher GLR suggests increased demand for borrowing gold or reduced supply from lenders.
Exchange for physicals (EFP) An exchange for physical transaction is a financial mechanism used to switch positions between gold futures contracts and physical gold. In other words, it allows market participants to exchange a futures contract position for the physical commodity or an equivalent OTC position (and vice versa). More concretely, in a gold EFP, two counterparties agree to simultaneously 1) sell (buy) gold futures contracts on a recognized exchange (like COMEX) and 2) buy (sell) an equivalent amount of physical gold or enter an OTC gold swap.
Typical market participants in leasing and EFPs
Leasing
Gold refineries are large users of borrowed gold. Typically, they must pay for feedstock shortly after it is delivered to the refinery, but they only get paid themselves when the gold has been refined, fabricated into bars or other forms, and sold. When demand for refined products increases rapidly, refineries can decide to increase gold borrowing to fund their larger work in progress.
EFPs
Exchange for physicals are used by a range of market traders.
The market quotes two types of EFPs:
- Spot EFPs are transactions where a market participant, typically a bank, sells the futures contracts and receives physical gold, which then needs to be stored. This can be beneficial, if the futures price is higher than the cost-of-carry (see footnote 2) for banks. That can materialise if, for instance, the funding costs for financial institutions are lower than what the futures price in.
- In Forward EFPs a trader sells a future contract and enters into a long physical position with the same maturity. As futures curves are usually upward-sloping, these transactions have a positive spread. Just before maturity, the forward EFP is usually closed. These transactions tend to be popular with funds because they can generate income, but there is no need to store the physical metal.
Gold market tightness is rare, but does occur Rising lease rates = falling gold forward swap rates
Forward and futures curves flatten and can flip into backwardation when the forward price of gold falls relative to the spot price. As noted, this is unusual, but it occurs. So what are the causes of a flatter forward curve or even a backwardation? Usually, it is linked to physical shortages, i.e. strong demand for immediate physical delivery of gold. This can happen when markets are in stress, i.e. through financial crises or geopolitical events that increase demand for safe-haven physical gold.
There are several examples of backwardation in the gold market:
- 2008 Global Financial Crisis. The collapse of Lehman Brothers and liquidity shortages meant that traders were on the look-out for safe-haven assets. Yet, banks were reluctant to lend gold, and investors wanted immediate physical delivery on concerns about the health of financial instruments. As a result, gold lease rates spiked and GOFO fell sharply, eventually turning negative.
- 2013 gold market turbulence. After gold had risen to US$1900/oz just a couple of years prior, prices fell below US$1300/oz in June 2013, prompting a sharp increase of demand from Asian buyers. Seeking to capitalise on this demand, dealers started to draw on inventories in COMEX warehouses and recast the 100oz bars into LBMA specifications or kilobars popular with Asian retail investors. The lease rate then rose because the additional refining and fabrication pushed up gold borrowing. •
- 2020 COVID-19 pandemic. COVID caused significant disruptions in gold logistics and supply chains; as refinery closures and restrictions on gold shipments created physical shortages. Futures curves flipped into backwardation as traders were willing to pay a “convenience yield”, i.e. immediate delivery became more valuable than future contracts. CME and LBMA then sat together and eased contract specifications, which meant that for a period of time even LBMA’s 400oz bars were accepted by CME, which helped to ease liquidity.
EFPs and lease rates have spiked again As noted, spot and forward EFPs have been a popular strategy with banks and funds. When President Trump took office and discussions around the implementation of tariffs gathered steam, EFPs became an issue. Indeed, the physical spot leg and the lease rates were priced in London, but the futures leg was priced on CME in New York, whose contract trades inclusive of duties. This became an issue when the US administration floated the implementation of tariffs on Canada and Mexico, before announcing levies of 25% from 1st February (these have been suspended for now). In a first step, the futures repriced quickly, squeezing the short legs in the EFPs.
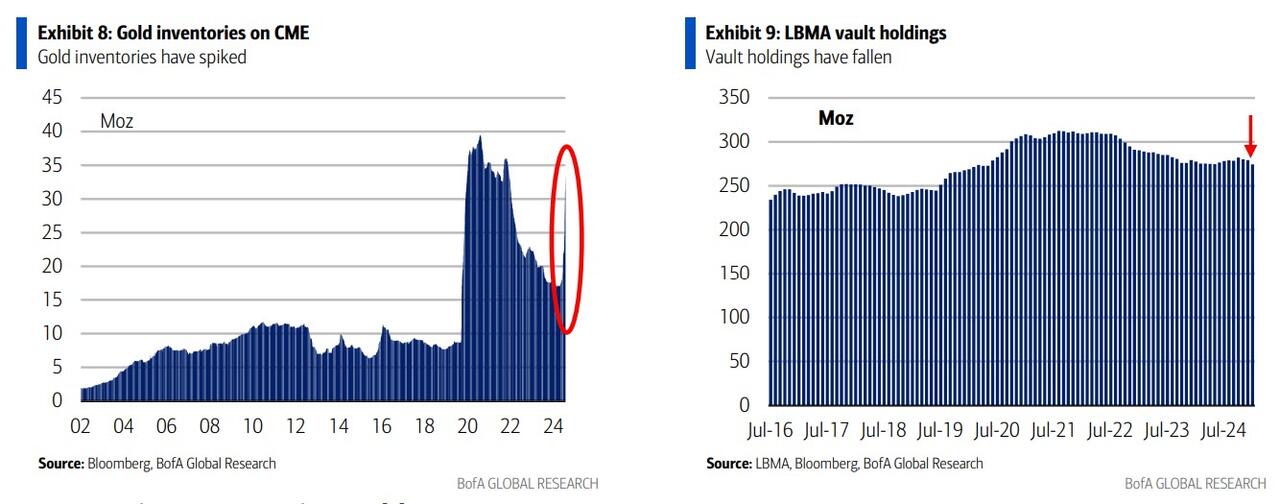
There were then concerns that trade restrictions would sustainably lift futures prices, while also making shipping gold into the US more expensive. Hence, banks started to send gold ounces to New York pre-emptively, with Exhibit 8 showing that inventories in CME warehouses have increased sharply in recent months. While this is not reflected in LBMA vaulting data yet (Exhibit 9; the last data point is November), this meant that the London market tightened materially.
The result? Gold swap and lease rates spiked. Commenting on that, Ruth Crowell, chief executive of the London Bullion Market Association confirmed that “There are challenges when the US is operating at this kind of premium (e.g. on the futures market), but it is something that the market is managing well”.
BofA remains constructive gold
Macro remains supportive
We reiterate our constructive gold view with a $3,000/oz target, as the macro backdrop remains very constructive. Indeed, fiscal imbalances in the US and other countries make the yellow metal an attractive asset to own for central banks. Persistent uncertainty over the policies of the US administration, alongside apprehension over trade disputes, also make gold attractive.
Interestingly, the gold market entertains sometimes "extremist" theories that are often hard to fully reconcile. To that point, for a long time, gold bugs have often thought that "Governments and banks have a vested interest in keeping gold prices low. High gold prices are often seen as a signal of weak confidence in fiat currencies. If gold were allowed to rise freely, it would expose the true extent of currency devaluation and the risks associated with excessive money printing". But then late last week, the FT ran a much-read story that the "unimaginable becomes imaginable" and there is speculation "about a revaluation of America’s gold stocks. Currently, these are valued at just $42 an ounce in national accounts. But knowledgeable observers reckon that if these were marked at current values — $2,800 an ounce — this could inject $800bn into the Treasury General Account, via a repurchase agreement. That might reduce the need to issue quite so many Treasury bonds this year". On the second argument, not reprinted in full, we agree that the US fiscal picture is not the strongest and that has been key to our bullish gold call, but the argumentation of the transmission was very different.
So while we are somewhat suspect of both theories above, we agree that the gold market is pricing in increased policy tensions. To pick just one, tariffs should at least initially put upwards pressure on USD, but then, there is a view among US policymakers that USD is too strong anyway. Accompanying this, the call for a weaker USD is also discussed along with a push to rebalance external accounts: on balance, and all else equal, lower current account deficits are a drag on capital inflows, but there are calls for USD to retain its reserve status (with central banks de-dollarising into gold).
Gold investment demand +10% = gold at $3,500/oz
Looking into flows, Exhibit 10 shows our gold supply and demand model. We model gold on a series of assumptions, including mine output, scrap supply and gold fabrication/jewellery demand.
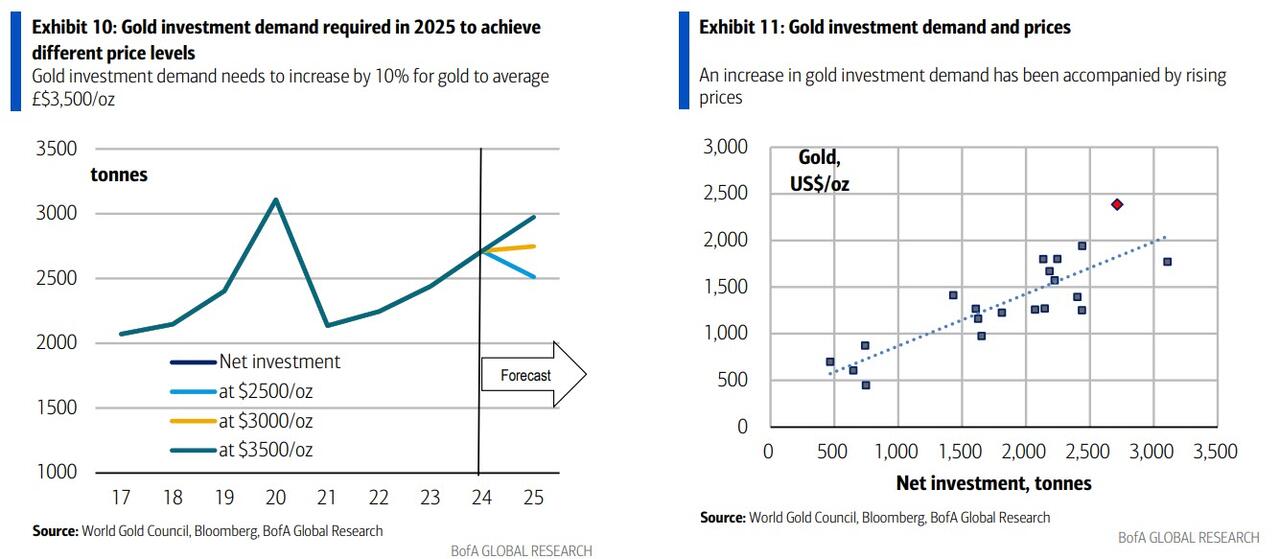
Given that scrap and jewellery demand in particular are influenced by prices, it is difficult to estimate a definite market balance without also setting a price level. To get around this problem, we ask how high investment demand, the marginal consumption driver, needs to be at different gold prices to balance the market.
The bottom line: to get gold to an average of $3,000/oz this year, investment demand needs to increase by just 1%. For gold to hit $3,500/oz, investment demand needs to rise by 10%. That’s a lot, but not impossible.
Indeed, to pick just one supportive dynamic, China’s Financial Supervision Administration has decided to launch a pilot program for insurance funds to invest in gold spot contracts, gold spot deferred delivery contracts, Shanghai gold centralized pricing contracts, gold price inquiry spot contracts, gold price inquiry swap contracts and gold leasing business listed or traded on the main board of the Shanghai Gold Exchange.
Our China insurance team estimates that China’s insurers have invested a total of RMB32tn, or USD4.4tn, so in keeping with the pilot’s outline (investment in gold shall not exceed 1% of the company's total assets at the end of the previous quarter), the potential inflows into gold could be in the region of RMB180-200bn, or USD25-28bn. Our colleagues also expect that companies will purchase gold actively and use their allowance within a year because insurers face declining investment returns in a low interest rate environment, while gold is regarded as a good long-term asset to hold. Putting concrete numbers behind this, the purchases could generate around 300 tonnes of gold purchases or 6.5% of the annual physical market.
Hence, this initiative could go a long way in carrying over last year’s support from physical investment. |


