Holiday lunch, simple, nutritious, and super yummy, before reflexology, and reflexology-induced nap
Fridays are great
Another datum from behind ZeroHedge curtain to take into deliberation (scroll down),

zerohedge.com
These Are The 10 Charts That Goldman's Traders Are Watching & Discussing Most...
BY TYLER DURDEN
FRIDAY, APR 18, 2025 - 08:45 AM
The headline message from Goldman's Christian Mueller-Glissman is simple: Remain defensive tactically as markets reprice stagflation risks
Below he highlights the 10 key charts the Portfolio Strategy team are currently watching and discussing most...
Exhibit 1: Our Risk Appetite Indicator (RAI) has declined sharply, but is currently above levels that historically have given a clear signal for better asymmetry[url=]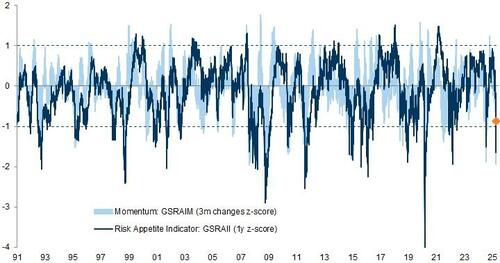 [/url] [/url]
Source: Goldman Sachs Global Investment Research
Exhibit 2: Positioning and sentiment have turned more bearish, and our aggregate indicator is nearing the bottom quartileAverage percentile of sentiment indicators (data since 2007)
[url=]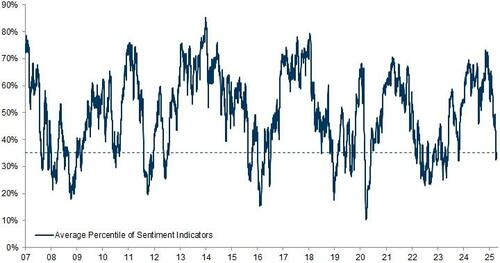 [/url] [/url]
Source: Datastream, Haver Analytics, EPFR, Goldman Sachs Global Investment Research
Exhibit 3: Our US macro baseline has become less friendly and points to stagflationAverage expanding z-score of macro and market variables across growth, inflation and policy. Dotted line based on GIR forecasts.
[url=]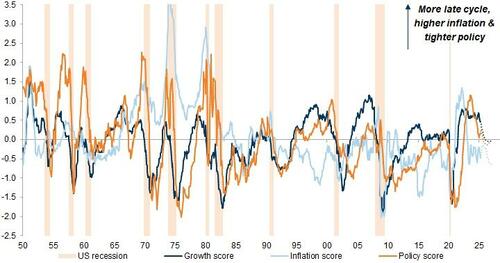 [/url] [/url]
Source: Haver Analytics, Bloomberg, Datastream, Goldman Sachs Global Investment Research
Exhibit 4: Our equity drawdown risk framework points to downside risk, with the drawdown probability peaking in the summer in our economists' baselineImplied probability of S&P 500 drawdown based on multi-variate logit model (Orange/light grey shading = S&P 500 subsequent drawdown >20%/>10%. Dashed line = unconditional probability). Dotted line based on GIR macro forecasts.
[url=]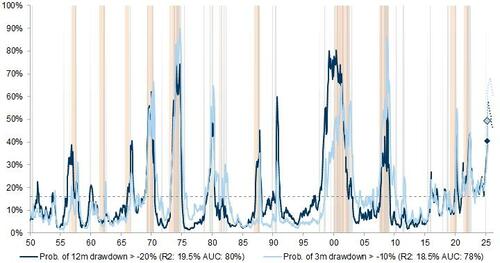 [/url] [/url]
Source: Haver Analytics, Datastream, Goldman Sachs Global Investment Research
Exhibit 5: Market pricing of recession risk in risky assets has picked upOrange shading: US recession. Dotted line: unconditional probability
[url=]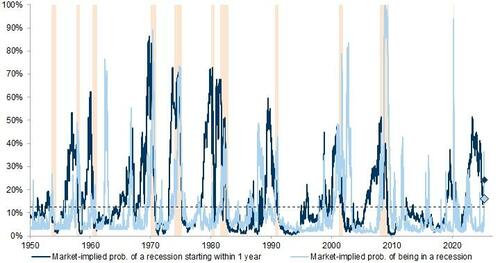 [/url] [/url]
Source: Datastream, Haver Analytics, Worldscope, Goldman Sachs Global Investment Research
Exhibit 6: Carry risk premia have picked up from low levels, although they are still below historical recessionary levelsAverage of back-expanding z-scores
[url=]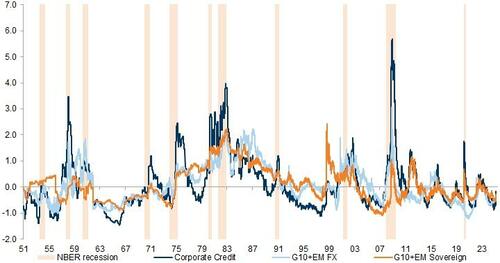 [/url] [/url]
Corporate credit (avg.): BBB vs. AAA, IG Credit, HY Credit. G10 + EM FX is the average between: the carry of top vs. bottom 3 G10 carry strategy and Top 5 EMFX strategy. G10 sovereign is the average carry of Italy, Spain, France, Greece and Portugal versus the Euro area benchmark. EM sovereign carry is calculated on the EM sovereign spread in USD. History extended based on BBB vs. AAA spreads.
Source: Robert Shiller, Haver Analytics, Goldman Sachs Global Investment Research
Exhibit 7: There should be some additional buffer from the Fed in case of a recessionBased on the price of 1Y1M swaptions vs. O/N rate
[url=]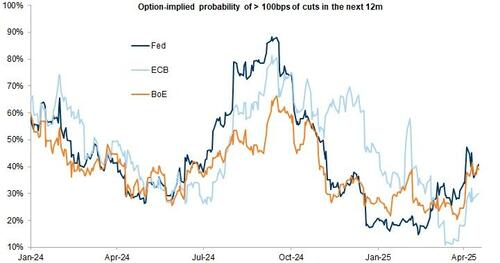 [/url] [/url]
Source: Goldman Sachs FICC and Equities, Haver Analytics, Goldman Sachs Global Investment Research
Exhibit 8: US exceptionalism in the last 15 years has been an exception[url=] [/url] [/url]
Assets: S&P 500, SXXP, DAX, FTSE, TOPIX, MSCI EM, US 2Y/10Y/30Y, Germany 10Y, Japan 10Y, UK 10Y, gold, oil, copper, S&P GSCI, DJ Corp, USD IG, USD HY.
Source: Haver Analytics, Datastream, Goldman Sachs Global Investment Research
Exhibit 9: More regional diversification opportunities due to cycle divergenceAverage pair-wise 1-year rolling correlation of equity markets (monthly returns) - orange shading denotes >10% S&P 500 drawdown
[url=]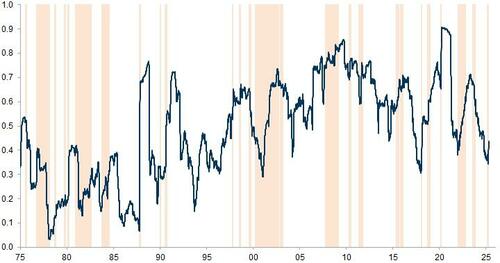 [/url] [/url]
Equity markets included: Australia, Austria, Belgium, Canada, Denmark, France, Germany, Hong Kong, Ireland, Italy, Japan, Malaysia, Netherlands, Norway, Singapore, South Africa, Sweden, Switzerland, UK, US.
Source: Datastream, Goldman Sachs Global Investment Research
Exhibit 10: Traditional 'safe havens' such as the Yen, CHF, and Gold are becoming more important diversifiers, with the Dollar increasingly positively correlated with equities1-year correlation with the S&P 500 (monthly returns)
[url=] [/url] [/url]
Source: Datastream, Goldman Sachs Global Investment Research |


