FRONTIER LITHIUM'S FEASIBILITY STUDY CONFIRMS CA$932M NET PRESENT VALUE AND LOW-COST CONCENTRATE SUPPLY FOR PAK LITHIUM PROJECT
Updated Mineral Reserve Estimate Confirms 37% Growth in PAK Project
newswire.ca
News provided by Frontier Lithium Inc. May 28, 2025, 22:17 ET
GREATER SUDBURY, ON, May 28, 2025 /CNW/ - Frontier Lithium Inc. (TSXV: FL) (FRA: HL2) (OTCQX: LITOF) (the "Company" or "Frontier") is pleased to report the results of its Definitive Feasibility Study ("FS" or "Study" or "DFS") for the Mine and Mill segment of PAK Lithium Project ("PAK Project" or "Project") near Red Lake, Ontario. The Study confirms the Project could generate an estimated CA$11 billion in net revenue over a 31-year mine life, with an after-tax net present value (NPV) of CA$932 million, an Internal Rate of Return (IRR) of 17.9%, and average annual pre-tax earnings of $285 million in steady-state operations. These robust economics land the Project competitively in the global hard rock lithium cost curve, supporting Frontier's goal to become North America's lowest-cost producer of spodumene concentrate.
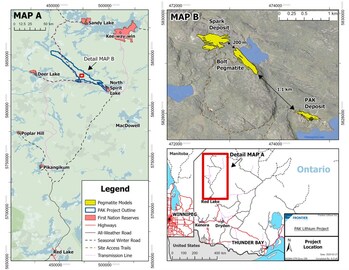
Figure 1: Map Showing a Plan View of the Resource Models For PAK, Spark and Bolt Deposits. (CNW Group/Frontier Lithium Inc.)
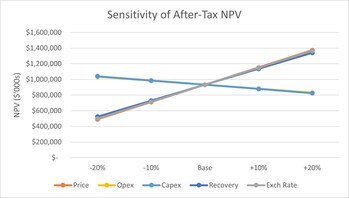
Figure 2: Sensitivity of NPV to Capex, Opex, Recovery, Exchange rate and Concentrate Price (CNW Group/Frontier Lithium Inc.)
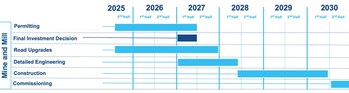
Figure 3: PAK Lithium Project, Mine and Mill Indicative Timeline (CNW Group/Frontier Lithium Inc.)
Building on a 37% increase in mineral reserves, the Study establishes a stronger foundation for an extended mine life, greater scale, and improved economic outcomes for the Project. The Project has also been streamlined to produce a single, high-quality spodumene concentrate (SC6), aligning with market demand and enhancing operational focus.
"This DFS is a key milestone that builds the confidence to advance permitting, infrastructure, and strategic partnerships. With strong projected economics, low costs, and long-term earnings, the Project could drive self-funded future growth and support Canada's Critical Minerals Strategy," said Trevor Walker, President and CEO. He added, "Canada's pro-battery policies give Frontier a strategic edge as regional lithium supply deficits are expected to continue into the 2030s. We're developing a high-quality, large-scale, low-cost lithium resource to anchor a domestic supply chain—strengthening energy security, competitiveness, and sustainability. This is more than a lithium project—it's about nation-building and delivering long-term value to shareholders and generations of Canadians, including northern and Indigenous communities."
Kota Ikenishi, General Manager of Battery Minerals Department at Mitsubishi Corporation, added: "We're very pleased with the release of this DFS, which marks an important step forward for the project just over a year after our investment. This progress reflects the strong commitment and capability of Frontier, and we truly appreciate their continued efforts. The DFS results highlight the project's outstanding quality and scale, showing that it stands among the top-tier lithium projects in North America. We believe that the PAK Project will make a meaningful contribution to building a reliable battery supply chain in Ontario, Canada and across North America. We look forward to continue working closely with our partner as the project moves toward production."
Highlights of the Feasibility Study
Strong Project Economics (All in Canadian Dollars unless otherwise stated)
The DFS outlines a phased development plan, consisting of with a mine and mill to produce 6% Li2O spodumene concentrate (SC6). The Project delivers compelling economics, including:
- Potential cumulative net revenue: CA$11 billion
- After-tax Net Present Value (NPV8%): CA$932 million
- After-tax Internal Rate of Return (IRR): 17.9%
- Average annual earnings (steady state): CA$285 million
- Life of Mine (LOM): 31 years
These results provide a robust basis for the Company to advance a Final Investment Decision (FID) target within the next 24 months.
Industry-Leading Cost Profile
- C1 Operating Cost1,2 (including transport): CA$602/t SC6 (US$439/t)[2]
- All-in Sustaining Cost (AISC)3,4: CA$624/t SC6 (US$456/t)
- Average Annual SC6 Production: 200,000 tonnes
- Life-of-Mine Stripping Ratio: 3.7:1 (waste:ore)
Concentrate transportation assumptions are based on free on board (FOB) terms at Thunder Bay, where Frontier recently acquired a vacant industrial site on Mission Island to house its planned lithium conversion facility5. These cost metrics position the PAK Project firmly in a competitive position on the global hard rock cost curve, underscoring its strong cost competitiveness and resilience in volatile market conditions.
Substantial Economic Contribution
- Over $1 billion in federal and $699 million in provincial tax revenues expected over the life of the Project.
- Additional $645 million of Ontario Mining Tax estimated for the province;
- Creation of more than 230 jobs at the mine site and sustained for the life of the Project.
_________________________________
| 1C1 Cost and C1 Cost per tonne of concentrate sold: C1 Cost consists of all production related expenses including mining, processing, services, tailings handling, royalties, and general and administrative, plus treatment charges, penalties, transportation and other selling costs. C1 Cost per tonne of concentrate sold is calculated as C1 Cost divided by tonnes of spodumene concentrate sold.
| 2 US$:CA$: 1.00:1.37
| 3 All-in Sustaining Costs (AISC) and AISC per tonne of concentrate sold: AISC consists of C1 Cost plus sustaining capital. AISC per tonne of concentrate sold is calculated as AISC divided by tonnes of spodumene concentrate sold.
| 4 C1 Costs and AISC are non-GAAP financial measures or ratios and have no standardised meaning under IFRS Accounting Standards and may not be comparable to similar measures used by other issuers. As the Project is not in production, Frontier does not have historical non-GAAP financial measures nor historical comparable measures under IFRS, and therefore the foregoing prospective non-GAAP financial measures or ratios may not be reconciled to the nearest comparable measures under IFRS
| 5 The lithium conversion facility will be developed separately by Frontier and is not included in the cost metrics described herein nor in the associated Technical Report.
|
Expanded Mineral Reserves, Resources and Exploration Upside
- Proven & Probable Reserves: 31.1 million tonnes @ 1.51% Li2O — a 37% increase over the Company's pre-feasibility study published in 2023.
- Maiden Inferred Resource at the Bolt deposit: 5.5 million tonnes @ 1.23% Li2O.
All deposits remain open at depth and with the recent Ember pegmatite discovery, located 1 km north of the Spark deposit, this further highlights the ongoing exploration upside and broader regional potential.
Frontier is advancing project financing and has commenced the permitting process which is expected to be completed within the next two years.
Table 1. PAK Project DFS – Summary of Key Results and Assumptions
Description
| Units
| Value
| Macroeconomic Parameters
| SC6 Spodumene Concentrate Price,
Long-Term
| US$
| 1,475
| US$:CA$ Exchange Rate, Long-Term
| US$:CA$
| 1.00:1.37
| Inflation Rate, Long-term1
| %
| 2.0
| Project Parameters
| Discount rate (real terms)
| %
| 8.0
| Mine life
| Years
| 31
| Mineable Mineral Reserves, Total
| Mt of ore
| 31.1
| Mineable Mineral Reserves, PAK
| Mt of ore
| 3.9
| Mineable Mineral Reserves, Spark
| Mt of ore
| 27.2
| Grade Mined, PAK (LOM average)
| % Li2O
| 1.96
| Grade Mined, Spark (LOM average)
| % Li2O
| 1.44
| Annual Mill Throughput (LOM average)
| Ktpa
| 1,040
| Lithium Recovery, PAK (LOM average)
| %
| 77.9
| Lithium Recovery, Spark (LOM average)
| %
| 77.5
| Concentrate Grade
| % Li2O
| 6.0
| Total Concentrate Produced (LOM)
| Mt
| 6.1
| Capital Expenditures (real terms)
| Development Capital
| CA$ M
| 943
| Sustaining Capital
| CA$ M
| 137
| Closure Capital
| CA$ M
| 60
| LOM Unit Operating Expenditure (real terms)
| Mining
| CA$/tonne of ore processed
| 28.7
| Processing
| CA$/tonne of ore processed
| 31.3
| Tailings Management Facility
| CA$/tonne of ore processed
| 1.2
| Non-process power
| CA$/tonne of ore processed
| 1.2
| Heating
| CA$/tonne of ore processed
| 0.9
| G&A5
| CA$/tonne of ore processed
| 23.7
| Total Opex
| CA$/tonne of ore processed
| 87.0
| Other Expenditures (real terms)
| Concentrate transport costs
| CA$/tonne of concentrate sold (wet)
| 143
| LOM Undiscounted Cash Flows (real terms)
| Net Revenue
| CA$ M
| 11,298
| Total Opex
| CA$ M
| (2,709)
| Closure Bond Fees
| CA$ M
| (19)
| Operating Earnings
| CA$ M
| 8,569
| Capital Expenditures
| CA$ M
| (1,138)
| Clean Technology Manufacturing Investment Tax Credit
| CA$ M
| 120
| Change in Working Capital
| CA$ M
| (15)
| Pre-Tax Cash Flow
| CA$ M
| 7,536
| Income Tax, Federal
| CA$ M
| (1,049)
| Income Tax, Provincial
| CA$ M
| (699)
| Mining Tax, Provincial
| CA$ M
| (645)
| After Tax Cash Flow
| CA$ M
| 5,144
| Cost Metrics (real terms)
| C1 Cost2, 4
| CA$/tonne of concentrate sold
| 602
| All-In Sustaining Cost (AISC)3, 4
| CA$/tonne of concentrate sold
| 624
|
Notes:
1. The inflation rate is used in the tax, depreciation, and working capital calculations only. The results of these calculations are deflated using the same inflation rate for use in the cash flow model.
2. C1 Cost and C1 Cost per tonne of concentrate sold: C1 Cost consists of all production related expenses including mining, processing, services, tailings handling, royalties, and general and administrative, plus treatment charges, penalties, transportation and other selling costs. C1 Cost per tonne of concentrate sold is calculated as C1 Cost divided by tonnes of spodumene concentrate sold.
3. All-in Sustaining Costs (AISC) and AISC per tonne of concentrate sold: AISC consists of C1 Cost plus sustaining capital. AISC per tonne of concentrate sold is calculated as AISC divided by tonnes of spodumene concentrate sold.
4. C1 Costs and AISC are non-GAAP financial measures or ratios and have no standardised meaning under IFRS Accounting Standards and may not be comparable to similar measures used by other issuers. As the Project is not in production, Frontier does not have historical non-GAAP financial measures nor historical comparable measures under IFRS, and therefore the foregoing prospective non-GAAP financial measures or ratios may not be reconciled to the nearest comparable measures under IFRS.
5. G&A Opex presented in this section includes allowances for operations insurance and community program payments.
6. Numbers may not add due to rounding.
|
Mineral Resource and Reserves Estimate
The PAK Project is a greenfield project located approximately 175 kilometers (km) north of the municipality of Red Lake, Ontario within the Red Lake Mining Division and the traditional territory of four First Nations (Figure 1). The Project spans nearly 28,000 hectares and hosts Ontario's highest-grade and largest lithium resource. Since 2013, Frontier has defined three high-quality spodumene-bearing deposits—PAK, Spark, and Bolt—located within just 3 km of each other. Ongoing exploration has also led to the discovery of two additional spodumene-bearing pegmatites Ember and Pennock, both situated within the broader Project area.
The Mineral Resource Estimates for the Project were based on 10,008 metres (m) drilled in 54 drillholes plus 244 m of surface channels at PAK; 22,956 m in 77 drillholes plus 363 m of channels at Spark and 3,085 m in 15 drillholes plus 134 m of channels at Bolt. The PAK Lithium Project's Proven and Probable mineral reserve is 31.1 million tonnes (Mt) averaging 1.51% Li2O, which is included within the Measured and Indicated mineral resource of 35.2 Mt averaging 1.53% Li2O. The mineral reserve and resource estimates for the PAK Lithium Project are summarized in Tables 2 through 4 below, which detail the drill and channel sampling data supporting the estimates, along with the breakdown of Proven and Probable reserves and the Measured and Indicated resources across the PAK, Spark, and Bolt deposits. Table 4 provides as well as a comparison between the 2023 PFS and 2025 FS Mineral Reserves.
Table 2: Summary of the Mineral Resource Estimate
| Deposit
| Category
| Li2O Cut Off Grade (%)
| Tonnage (kt)
| Li2O Grade (%)
| Contained Li2O (kt)
| Open Pit
| PAK
| Measured
| 0.65
| 2,585
| 2.03
| 52
| Indicated
| 1,521
| 1.96
| 30
| Measured + Indicated
| 4,106
| 2.00
| 82
| Inferred
| 122
| 1.50
| 2
| Spark
| Measured
| 0.65
| 13,796
| 1.54
| 212
| Indicated
| 17,304
| 1.41
| 244
| Measured + Indicated
| 31,100
| 1.47
| 456
| Inferred
| 10,954
| 1.53
| 167
| Bolt
| Measured + Indicated
| 0.65
| -
| -
| -
| Inferred
| 5,516
| 1.23
| 68
| Total
| Measured
| 0.65
| 16,381
| 1.61
| 264
| Indicated
| 18,825
| 1.45
| 273
| Measured + Indicated
| 35,206
| 1.53
| 538
| Inferred
| 16,592
| 1.43
| 237
| Underground
| PAK
| Measured
| 0.80
| -
| -
| -
| Indicated
| 1,703
| 2.39
| 41
| Measured + Indicated
| 1,703
| 2.39
| 41
| Inferred
| 1,995
| 2.19
| 44
|
1. The Mineral Resource Estimate has been estimated using the Canadian Institute of Mining, Metallurgy and Petroleum (CIM) Definitions Standards for Mineral Resource and Mineral Reserve in accordance with National Instrument 43-101 - Standards of Disclosure for Mineral Projects. Mineral Resources which are not Mineral Reserves, do not have economic viability.
| 2. Inferred Mineral Resources are exclusive of the Measured and Indicated Resources.
| 3. In-pit Resources are constrained by Pseudoflow optimized pit shells using HxGn MinePlanTM 3D
| 4. Pit shells were developed using pit slopes of 45 0 for PAK and Bolt and 43 degrees for Spark, sales price of U$1,500/t for 6.0% Li2O chemical grade concentrate, exchange rate of 1.30 CA$/US$, mining costs of US$7.80/t and US$7.15/t for ore and waste, respectively, processing costs of US$23.85/t milled, G&A costs of US$26.22/t milled, sustaining capital costs of US$4.28/t milled, closure costs of US$1.99/t milled, process recovery of 78.0%,and transportation costs of US$100.79/t concentrate..
| 5. In-pit estimates are reported in-situ, at a cut-off grade of 0.65% Li2O.
| 6. Underground mining stope optimization was performed using DeswikTM.
| 7. Stope shapes were developed using a sales price of US$1,500/t for 6.0% Li2O chemical grade concentrate, exchange rate of 1.30 CA$/US$, mining costs of US$85.00/t, processing costs of US$23.85/t milled, G&A costs of US$26.22/t milled, sustaining capital costs of US$4.28/t milled, closure costs of US$1.99/t milled, process recovery of 78.0%, and transportation costs of US$100.79/t concentrate.
| 8. Underground resources were estimated using a cut-off grade of 0.80% Li2O.
| 9. Resource estimations were interpolated using Inverse Distance Weighting (IDW2); variable densities were also interpolated using the same method.
| 10. The effective date of the Mineral Resource Estimate is November 30, 2023.
| 11. The independent and Qualified Person for the Mineral Resource Estimate, as defined by NI 43-101, is Schadrac Ibrango, P.Geo., of DRA Americas Inc.
| 11. Figures have been rounded to an appropriate level of precision for the reporting of Mineral Resources. Thus, totals may not compute exactly as shown.
| Notes:
Table 3: Summary of Mineral Reserve Estimate
Open Pit
| Deposit
| Category
| Li2O Cut Off Grade (%)
| Diluted Tonnage (kt)
| Li2O Grade (%)
| Contained Li2O (kt)
| PAK
| Proven
| 0.65
| 2,520
| 1.97
| 50
| Probable
| 1,427
| 1.94
| 28
| Proven + Probable
| 3,947
| 1.96
| 77
| Spark
| Proven
| 0.65
| 13,670
| 1.51
| 206
| Probable
| 13,514
| 1.37
| 185
| Proven + Probable
| 27,183
| 1.44
| 392
| Total
| Proven
| 0.65
| 16,190
| 1.58
| 256
| Probable
| 14,941
| 1.42
| 213
| Proven + Probable
| 31,131
| 1.51
| 469
|
Notes:
| 1. The Mineral Reserve Estimate has been estimated using the Canadian Institute of Mining, Metallurgy and Petroleum (CIM) Definitions Standards for Mineral Resource and Mineral Reserve in accordance with National Instrument 43-101 - Standards of Disclosure for Mineral Projects.
| 2. The mineral reserve was derived from a pit limit analysis and detailed pit design using Measured and Indicated Resources at a cut-off grade of 0.65% Li2O.
| 3. Pit optimization was performed using pit slopes of 45° for PAK and Bolt and 43° degrees for Spark, sales price of U$1,500/t for 6.0% Li2O chemical grade concentrate, exchange rate of 1.30 US/CAD, mining costs of US$7.80/t and US$7.15/t for ore and waste, respectively, processing costs of US$23.85/t milled, G&A costs of US$26.22/t milled, sustaining capital costs of US$4.28/t milled, closure costs of US$1.99/t milled, process recovery of 78.0%, transportation costs of US$100.79/t concentrate, discount rate of 8%, and assumed production rate of 1.04 Mtpa.
| 4. For PAK, the pit shell selected for the ultimate pit design is RF 0.60, based on a selling price of US$900 for a 6.0% Li2O chemical-grade concentrate. For SPARK, the selected pit shell for the ultimate design is RF 0.45, corresponding to a selling price of US$675 for a 6.0% Li2O chemical concentrate.
| 5. For the PAK and SPARK deposit, the mineral reserve estimate includes external dilution and mining loss.
| 6. PAK mineral reserves are based on a pit design with a 5.9 stripping ratio. SPARK mineral reserves are based on a pit design with a 3.3 stripping ratio.
| 7. The effective date of the Mineral Reserve Estimate is May 28, 2025.
| 8. The independent and Qualified Person for the Mineral Reserve Estimate, as defined by NI 43-101, is Ghislain Prevost, P.Eng., of DRA Americas Inc.
| 9. Figures have been rounded to an appropriate level of precision for the reporting of Mineral Reserves. As a result, totals may not compute exactly as shown.
|
Table 4: Comparison of 2023 and 2025 Mineral Reserve Estimates
2025 - DFS Reserve
| 2023 - PFS Reserve
| Increase kts Li2O (PFS-DFS)
| Cut-off Li2O%
| Resource Category
| Tonnage (kt)
| Li2O %
| kts Li2O
| Cut-off Li2O%
| Resource Category
| Tonnage (kt)
| Li2O %
| kts Li2O
| PAK - Open Pit
| PAK - Open Pit
| 0.65
| Proven
| 2,520
| 1.97
| 50
| 0.65
| Proven
| -
| -
| -
|
| Probable
| 1,427
| 1.94
| 28
| Probable
| 4,041
| 1.79
| 72
| -62 %
| Proven-Probable
| 3,947
| 1.96
| 77
| Proven-Probable
| 4,041
| 1.79
| 72
| 7 %
| Spark - Open Pit
| Spark - Open Pit
|
| 0.65
| Proven
| 13,670
| 1.51
| 206
| 0.65
| Proven
| -
| -
| -
|
| Probable
| 13,514
| 1.37
| 185
| Probable
| 18,028
| 1.50
| 270
| -32 %
| Proven-Probable
| 27,183
| 1.44
| 392
| Proven-Probable
| 18,028
| 1.50
| 270
| 45 %
| PAK Lithium Project
| PAK Lithium Project
|
| 0.65
| Proven
| 16,190
| 1.58
| 256
| 0.65
| Proven
| -
| -
| -
|
| Probable
| 14,941
| 1.42
| 212
| Probable
| 22,069
| 1.55
| 343
| -38 %
| Proven-Probable
| 31,131
| 1.51
| 469
| Proven-Probable
| 22,069
| 1.55
| 343
| 37 %
|
Project Economics
The PAK Project's mine and mill is designed to produce 200,000 tonnes of chemical-grade concentrate annually, totaling approximately 6.1 million tonnes over a 31-year mine life. The Project is expected to generate a total of $5.14 billion in after-tax cash flow, driven by strong operating margins and capital requirements.
With projected net revenue of $11.3 billion, the financial plan includes $943 million in initial development capital, $137 million in sustaining capital, and $60 million in closure costs. This capital structure supports robust cash generation with average annual earnings of $285 million. These figures underscore the Project's potential to deliver strong and sustained economic returns.
The long-term spodumene concentrate price assumption of US$1,475 per tonne, on a FOB basis at Thunder Bay, supports the Project's economic modeling. This assumption is informed by a pricing study incorporating forecasts from SC Insights, a battery supply chain consultant, and several financial institutions. While the lithium market remains in an early stage of development, structural demand growth, primarily driven by the electric vehicle sector, combined with forecasted regional supply deficits, supports a sustained positive price environment. These fundamentals support a strong long-term outlook for spodumene concentrate pricing.
The base case for the PAK Project delivers an after-tax NPV8% of $932 million, an IRR of 17.9%, and a 4.0-year payback period reflecting strong fundamentals. Sensitivity analysis shows Project value is most responsive to spodumene concentrate prices. For example, a 20% increase in spodumene concentrate prices raises NPV of the Project to $1.37 billion and IRR to 21.6%, while a 10% decrease in spodumene concentrate prices reduces the NPV of the Project to $712 million and the IRR to15.9%. The economic analysis is based on an assumed FID in first half 2027 and project kick off in June 2026.
Operating and capital costs for the Project have a more moderate sensitivity impact. A 20% decrease in total Opex lifts NPV to $1.03 billion (IRR 18.9%), while a 20% increase reduces it to $830 million (IRR 17.0%). Capex shifts of ±20% move NPV between $1.04 billion and $824 million, with IRR ranging from 21.0% to 15.7%.
Overall, the PAK Project remains resilient under varied scenarios. Figure 2 below, demonstrates the Project's ability to maintain robust economics across a range of key variables including capital and operating costs, exchange rates, and concentrate pricing.
Project Schedule
The overall schedule for the Mine and Mill segment of the PAK Lithium Project has been developed during the DFS. Frontier anticipates to secure key permits by the first half of 2027, which would enable the FID. In parallel, a critical infrastructure initiative, the Beren's River Bridge and all-season road, is expected to commence in 2025 and be completed by the end of 2027 to more readily access the Project. An indicative timeline of the major Project segments is presented in Figure 3 below.
Prior to advancing the Project to detailed engineering, the Project schedule will be revisited and is subject to final design engineering, permitting approvals, infrastructure upgrades, market conditions and project financing activities. In addition, Frontiers intends to actively pursue opportunities to optimize capital and operating costs, as well as potential resource expansion, for integration to enhance overall Project efficiency.
Project Advancement & Opportunity Optimization
Frontier remains committed to advancing the mine and mill towards production, while identifying opportunities to optimize the broader integrated development. Key ongoing activities supporting this goal include:
- Progressing through the permitting process while actively engaging and consulting with First Nations and with governmental agencies. The next major permitting milestones are Environmental Compliance Approval - Air Emissions and Noise; Industrial Sewage and the Closure Plan.
- Advancing development of all-season road access and infrastructure in the region through engagement and consultation with First Nations and with federal and provincial support.
These actions are consistent with Frontier's goal of advancing the fully integrated PAK Lithium Project, starting with the mine and mill near Red Lake and becoming a leading lithium producer in North America. Advancing the upstream segments and securing concentrate production are essential steps toward enabling local conversion and capturing investment in Ontario's emerging battery and electric vehicle supply chain.
Report Filing
The complete NI 43-101 technical report associated with the DFS will be available on SEDAR+ at www.sedarplus.ca under the Company's issuer profile, as well as the Company's website at www.frontierlithium.com within 45 calendar days of this press release.
Qualified Persons
All scientific and technical information in this release has been reviewed and approved by QP Schadrac Ibrango, P.Geo., of DRA Americas Inc., QP Ghislain Prévost, P.Eng. of DRA Americas Inc., and QP Garth Drever, P.Geo., VP Exploration for Frontier Lithium Inc. under the definitions established by National Instrument 43-101. Under Frontier's QA/QC procedures, all drilling was completed by Chenier Drilling Ltd. of Val Caron, Ontario using BTW and NQ drill rods and a Reflex ACT III oriented core system. Using the Reflex system, the drill core was oriented and marked as it was retrieved at the drill. Either a Reflex EZ-Trac survey or a Reflex Gyro Sprint-IQ instrument was used every 50 m downhole and again at the end of each hole when rods were pulled out. A Reflex North Finder APS unit was utilized to complete accurate positioning and orientation of the drill collar upon setup. The core was boxed and delivered to the Frontier core shack where it was examined, geologically logged, and marked for sampling. The core was photographed prior to sampling. Using a rock saw, the marked sample intervals were halved with one-half bagged for analysis. Sample blanks along with lithium certified reference material was routinely inserted into the sample stream in accordance with industry recommended practices. Field duplicate samples were also taken in accordance with industry recommended practices. The samples were placed in poly sample bags and transported to AGAT Laboratories Ltd. (AGAT) in Thunder Bay, Ontario for sample preparation and to Mississauga, Ontario for processing and quantitative multi-element analysis. AGAT is an ISO accredited laboratory. The core is stored on site at the Company's Knox exploration camp.
About Frontier Lithium
Frontier Lithium is a pre-production company committed to enabling electrification by delivering sustainably sourced lithium products, responsibly mined and processed in northern Ontario, to support North America's electric vehicle and battery industries. The Company's PAK Lithium Project holds the largest land position and proven lithium resource in Ontario's premier lithium district, located in the Great Lakes region.
About the PAK Lithium Project
The PAK Lithium Project is a fully integrated lithium development initiative advancing the highest-grade known lithium resource in North America. Operated as a joint venture between Frontier Lithium Inc. (92.5%) and Mitsubishi Corporation (7.5%), the project includes two key segments: Mine and Mill, and Downstream Conversion Facility for battery-grade lithium salt production. A 2025 Feasibility Study (FS), prepared by DRA and entitled National Instrument 43-101 Technical Report FS PAK Lithium Project, Mine and Mill, outlines a 31-year Project life with an after-tax NPV of CA $932 million at an 8% discount rate and an after-tax IRR of 17.9%. These results were disclosed in a press release dated May 28, 2025, and will be filed on SEDAR+ ( www.sedarplus.ca). The full technical report will be filed within 45 days of the press release.
Cautionary Note Regarding Forward-Looking Statements
This news release includes certain statements that may be deemed "forward-looking statements". All statements in this release, other than statements of historical fact constitute forward-looking statements. Forward looking statements contained in this news release may include, but are not limited to, statements with respect to: estimated mineral resources, estimated capital costs and timing to construct mine facilities, estimated operating costs (including sustaining costs and improvements in respect thereof), all estimates and assumptions relating to the economic analysis and financial summaries, the duration of payback periods, expected strip ratios, estimated amounts of future production, estimated accumulated revenues, estimated cash flows, lithium prices and assumptions, net present value, internal rate of return, the DFS, technical report, the pre-feasibility study and its assumptions, and statements that address future production, resource and reserve potential, exploration drilling, exploitation activities and events or developments that the Company expects.
Although the Company believes the expectations expressed in such forward-looking statements are based on reasonable assumptions, such statements are not guarantees of future performance and actual results may differ materially from those expressed in the forward-looking statements.
Forward-looking statements involve inherent risks and uncertainties. Risk factors that could cause actual results to differ materially from those in forward looking statements include: the Company may not develop its mineral projects into a commercial mining operations, lithium prices and assumptions as the lithium market continues to evolve to a more centralized market and away from a concentrated market in China and as such the lithium market and its pricing does not yet possess the price certainty features that other tradeable metals with a more mature market have, making price assumptions and forecasting for lithium complex and uncertain, accuracy of mineral reserve and resource estimate and related assumptions, increases in capital or operating costs, construction timing, costs and risks of completion, availability of infrastructure including roads, regulatory and permitting risks, exploitation and exploration successes, continued availability of capital and financing (both private and public), financing costs, and general economic, market or business conditions. Investors are cautioned that any such statements are not guarantees of future performance and those actual results or developments may differ materially from those projected in the forward-looking statements. For more information on the Company, please review the Company's public filings available at www.sedarplus.ca.
Neither the TSX Venture Exchange nor its Regulation Services Provider (as that term is defined in the policies of the TSX Venture Exchange) accept responsibility for the adequacy or accuracy of this release.
SOURCE Frontier Lithium Inc.
 Company Contact Information: Bora Ugurgel, Senior Manager, Investor Relations, 2614 Belisle Drive, Val Caron, Greater Sudbury, ON., P3N 1B3 CANADA, T. +001 705.897.7622, F. +001 705.897.7618 Company Contact Information: Bora Ugurgel, Senior Manager, Investor Relations, 2614 Belisle Drive, Val Caron, Greater Sudbury, ON., P3N 1B3 CANADA, T. +001 705.897.7622, F. +001 705.897.7618
|


