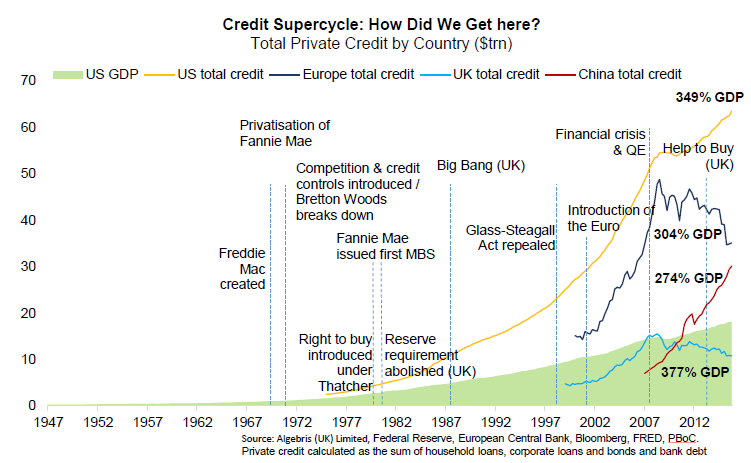
The Credit SuperCycle as presented on the World Economic Forum website
The 72 year master cycle in the US 30 year Treasury bond --- The US entered a secular bull market in yield (interest rates are going higher) and bear market in bond prices on July 8 2016. We are now in the
wave of advance that the general Wall street and global financial community comes to the mass realization
that interest rates are going up.

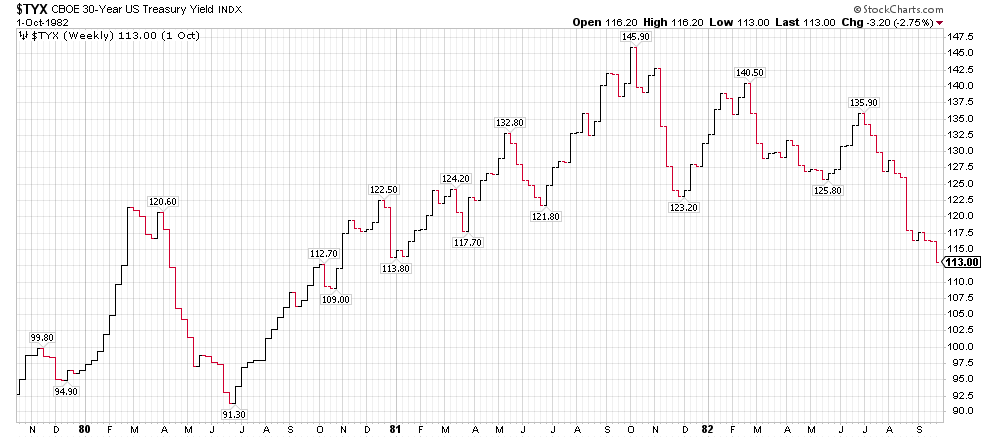
THE 30 YEAR US TREASURY BOND WEEKLY CHART FROM LATE 1979 TO SEPTEMBER 1982
THE High in Yield was 14.59% on Oct 12 1981.
we have a number of global central banks taking steps to normalize interest rates, which means to raise them and since we have had 8 years of global Zero interest rate policy, on short rates in the US, the ECB, the BOJ, the SNB - swiss national bank, the swedish Riskbank, the BOE was very accomodative...
and so it's a brave new world of the reduction of monetary stimulus and we have already had 3 or 3 Fed Fund increases here in the US.... are we up to 4 already? We have another coming in Dec.
and we have never seen the global central banks in this position, We have the FED, the Bank of England, the Reserve Bank of Australia, the central bank of Canada, and the European Central bank all in tightening
mode....... .. they have never been in this position and in central banking land.... mistakes in the movement of the short term borrowing rates can occur, especially when you have multiple countries doing the same thing... It sets up uncertainty in the Long dated FX market.... creates uncertainty for Banking, Insurance, Reinsurance companies as to how to hedge and value their long dated commitments.
Endowments, pension funds , soverign wealth funds are also all impacted by this grand experiment.
as Hyman Minsky famously said "stability is Destabilizing" that has always been the case and
will always be the case...we have been through a long period of stability which has let lots of all of the
above market participants, companies, hedge funds.... take advantage of very cheap credit by issuing a vast
ocean of it.... we shall find out who is over levered..... and then their are exogenous shocks and black swan
events.
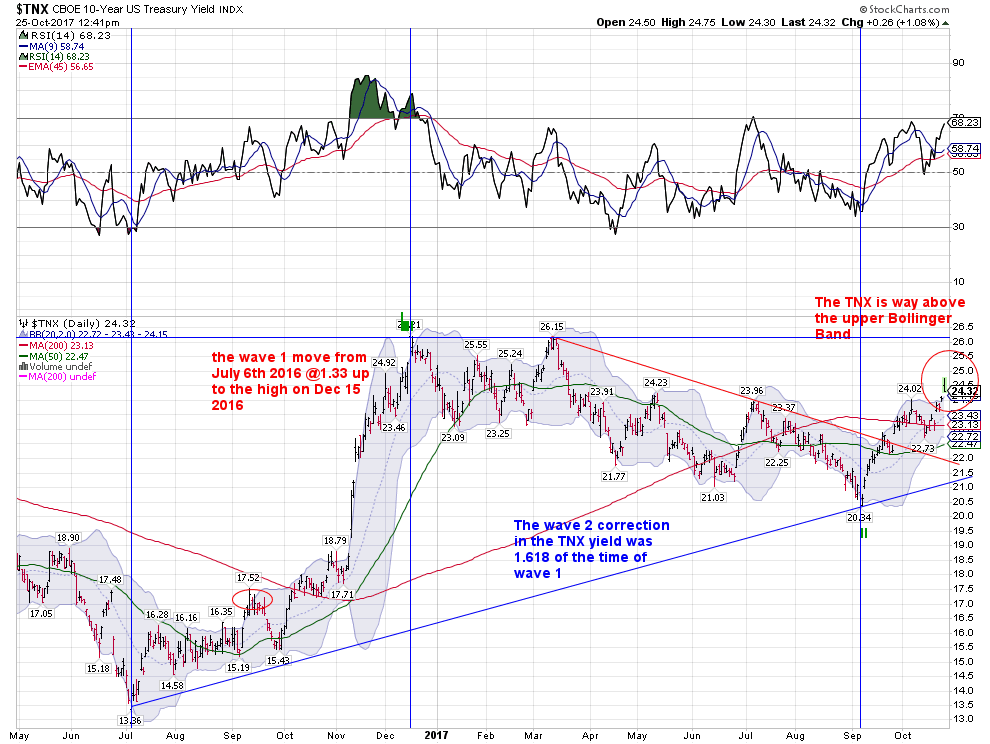
The US 10 year note up to 2.46%...... huge durable goods number... going back to 2.62... the high of wave 1 of the secular bond bear market... we had a double bottom at 1.33 in July of 2012 and then again on July 8th of 2016.
The Consumer confidence number recent reports have been the most bullish since November of 2000!
The University of Michigan PMI
Back then long rates around the world were negative and going lower like bond prices would never stop going up in price and down in yields.
Japanese 10 Year government bonds went up 40 to 50% in 5 months in the first half of 2016.
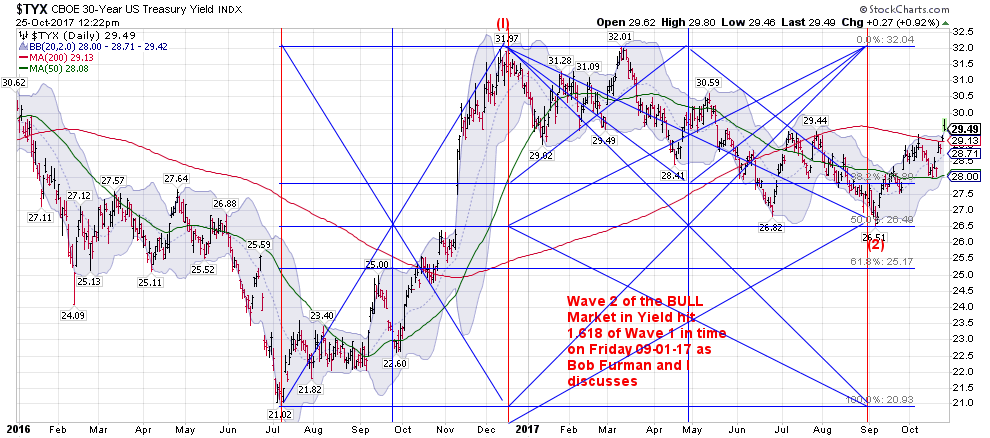
18 MONTHS OF THE 30 YEAR US BOND MARKET
18 MONTHS OF THE 10 YEAR US TREASURY NOTE YIELD CHART
this chart does not reflect the move higher to 2.46% today..... the Yield has not been this far outside of the Bollinger band in years as the bond market moves with lightening speed upward since the low at 2.00 on Friday October 8th 2017.
we have a synchronized global central bank rate normalization and interest rate increases with The FED,
the Bank of England, the Reserve Bank of Australia, The central bank of Canada and the European central
bank should be preparing to reduce monetary stimulation when the ECB head speaks in 17 hours.
the risk of the central banks making a mistake and the global equity markets general dismissal of this changing environment is setting us up for the largest correction in the last few years. End of the Bull
Market since March 9th, 2009..... no one knows but the NDX pullback that I have discussed is most certainly underway.
THE low for the US 30 year interest rate OCCURRED WITHIN 4 DAYS of our idealized low on . It Illustrates the key point that calendar days are often more important than market days when working with time cycles.
Also time cycles, besides have right hand translation in a bull market (where prices advance for the first 2/3 or so of the time cycle and then decline into the cycle low) and leftward translation in bear markets. In bear markets price tend to have a rally off of the cycle low which is shorter lived and then prices resume the downtrend into the next cycle low from 55 to 75 % of the cycle. There are several theories as to the causation of time cycles and there are multiple cycles at work in a market at any point in time. They wax and wane in their power and importance, and when several time cycles cluster together they can produce a
more powerful significant low, as well as provide the upward energy when several of them cluster in their
up phase.
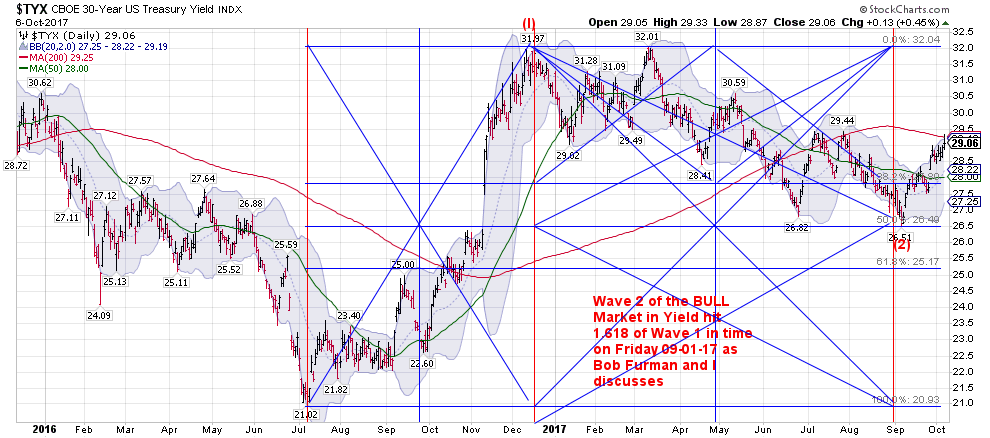
My Time projection work was partly done using the retracement of wave 2 being 1.618 of the time of
the impulse wave 1.... However i used my Fibonacci ratio compass on the market days on the chart, I noticed a difference of several days when I used the time in days of the wave 1 off the July 8th 2016 low and the Dec 16th High. Now remember that this is the 30 year bond the Very long end of the curve, and it acted differently than the 10 year note. As the 30 year yield had a slightly higher high on March 10. Very different from the 10 year note behavior.
Of course the 36 year cycle low was put into place on July 8th 2016........ we have already embarked on a multiyear bear market in bonds and a multi year rise in interest rates. Which makes sense with all of the asset bubbles that have been going on with the 1% ers..... who are very out of favor with the very angry DJT voters, the Bernie Sanders voters, the Elizabeth Warren and Barney Frank parts of the Democratic
Party and that's a cumulative 70% of the population.... at least.
The 36 year cycle in the bond bull market that began on Oct 9th 1981 at 14.59% yield on the 30 year bond
Ended on July 8th 2016. The Between July 5th and 8th The BOJ, The ECB and the SNB pulled the plug on
driving the long end of the Major Global Sovereign Bonds into Lower and Lower Negative Yield world. The
Fed was also a Master architect of the end of the $16 Trillion dollar Series of Quantitative Easings and
endless balance sheet expansions of the Central Banks balance sheets, as we had asset bubbles in
global Real Estate in Hong kong, New York, London, Paris, Miami, Vancover etc, as well as asset Bubbles in the High end of the Fine Art Market and other markets of the 1% ers.
This Chart was posted on Sept 3 rd, and due to the extreme exegencies of Hurricane Harvey and the soon to be emerging Hurricane Irma, coupled with some ECB machinations..... we also briefly got down to almost 2% in yield overnight during the weekend of Hurricane Irma.
And moved like grease lightening of of that 2.00% area briefly touched overnight and in the overseas markets and vaulted back to 2.35% with such impulse power... accompanied by upside gaps that I doubt we see 2.13% again this year, which is a key level from several Fibonacci cluster, GANN price zones as well
as it's a critical level so that the yield curve does not start to de facto invert.regarding a number of large derivative interest rate swaps geared to that level.
--------------------------------------------------------------
( I know all about BNP ---- the Major French Global superpower bank,
and I know plenty about Bank of America / MLynch ..
Edgewater Prime Broker is not a household name.....I have some homework as U can see...
(((and all you Investors and traders..... Not to worry.... Nothing to see here.....Nothing at all... Move along -vbg .... the sun will come out tomorrow...You may bet your bottom dollar on Tomorrow... oh that's right it already is tomorrow as one heads far enough west...we end up across the international date line and it is tomorrow.)))
Auckland, New Zealand is pretty much the kicking off point for the Global foreign exchange
markets and FX options, Long dated FX which by definition is also dealing with interest rates movements globally going into the FUTURE , and that my friends is the start of the bread crumb trail....
of what moves all asset prices.........
obviously exogenous events such as an earthquake that destroys Los Angeles.... major wars...... and
other Geopolitical events occur... price discovery and price action occurs like grease-midnight lighting in
the currencies (and remember that EVER other financial asset is denominated in CURRENCY TERMS.
DOES THIS MAKE SENSE TO ANYONE?
and......The Thinnest liquidity comes out of long weekends, Holidays and every single weekend... and each day... This is significant tactical info... and is only understood for whom it applies to)))
Andy Krieger of Bankers Trust really took advantage of the thinness of the market in the NZD and had
some fairly suspect valuations placed on his book of FX options, Long dated FX... etc
No. 3: Andy Krieger Vs. the Kiwi
In 1987, Andy Krieger, a 32-year-old currency trader at Bankers Trust, was carefully watching the currencies that were rallying against the dollar following the Black Monday crash. As investors and companies rushed out of the American dollar and into other currencies that had suffered less damage in the market crash, there were bound to be some currencies that would become fundamentally overvalued, creating a good opportunity for arbitrage. The currency Krieger targeted was the New Zealand dollar, also known as the kiwi.
Using the relatively new techniques afforded by options, Krieger took up a short position against the kiwi worth hundreds of millions of dollars. In fact,
One part of the legend recounts a worried New Zealand government official calling up Krieger's bosses and threatening Bankers Trust to try to get Krieger out of the kiwi. Krieger later left Bankers Trust to go work for George Soros.
FOUNDTIONS--- The keys to the Kingdom of Tax effective Asset preservation and growth for the long haul...... leave a legacy for the ages.
Message 31222122
Message 31130406
Message 31130731
ignore the nonsense about Housing topping out.... we did not know that interest rates could go negative
and long dated sovereign Government rates in countries such as Japanese JBG's were going to go so
far into negative yield area..... at least I didn't in 2013.... (I sure wish someone had told me that ahead of
time
how a little more on Andy Krieger...
Message 28978310

edgewatermarkets.com
-------------------------------------------------------------------------------
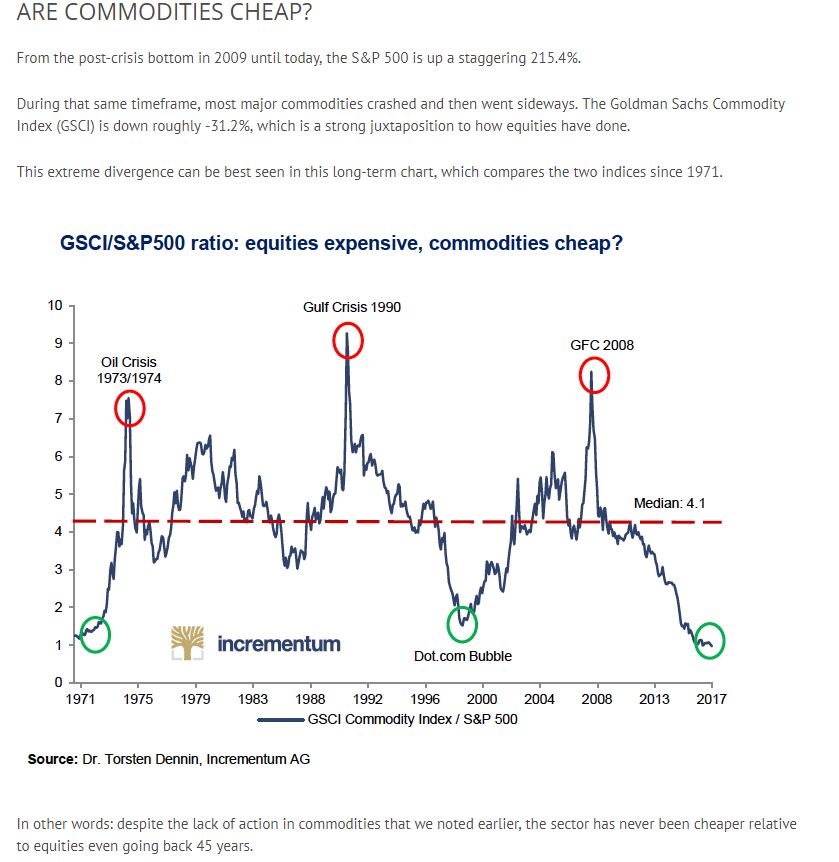
This is a VERY PROFOUND CHART...... In has Implications for Equity Prices, Commodity prices,
Interest Rate directions and also will be impacting the Major Currencies.
 |


