THE 10 YEAR WEEKLY CHART OF THE "BIG 3 " Global Bond Markets
The turn on a dime top in price --- bottom in Yield in the Big 3 Global Bond Markets

The 1 year chart of daily YIELD action amplifies the wild thrashing by Japan and Germany (the ECB)

------------------------------------------------------------------------------------------------------------------------------------
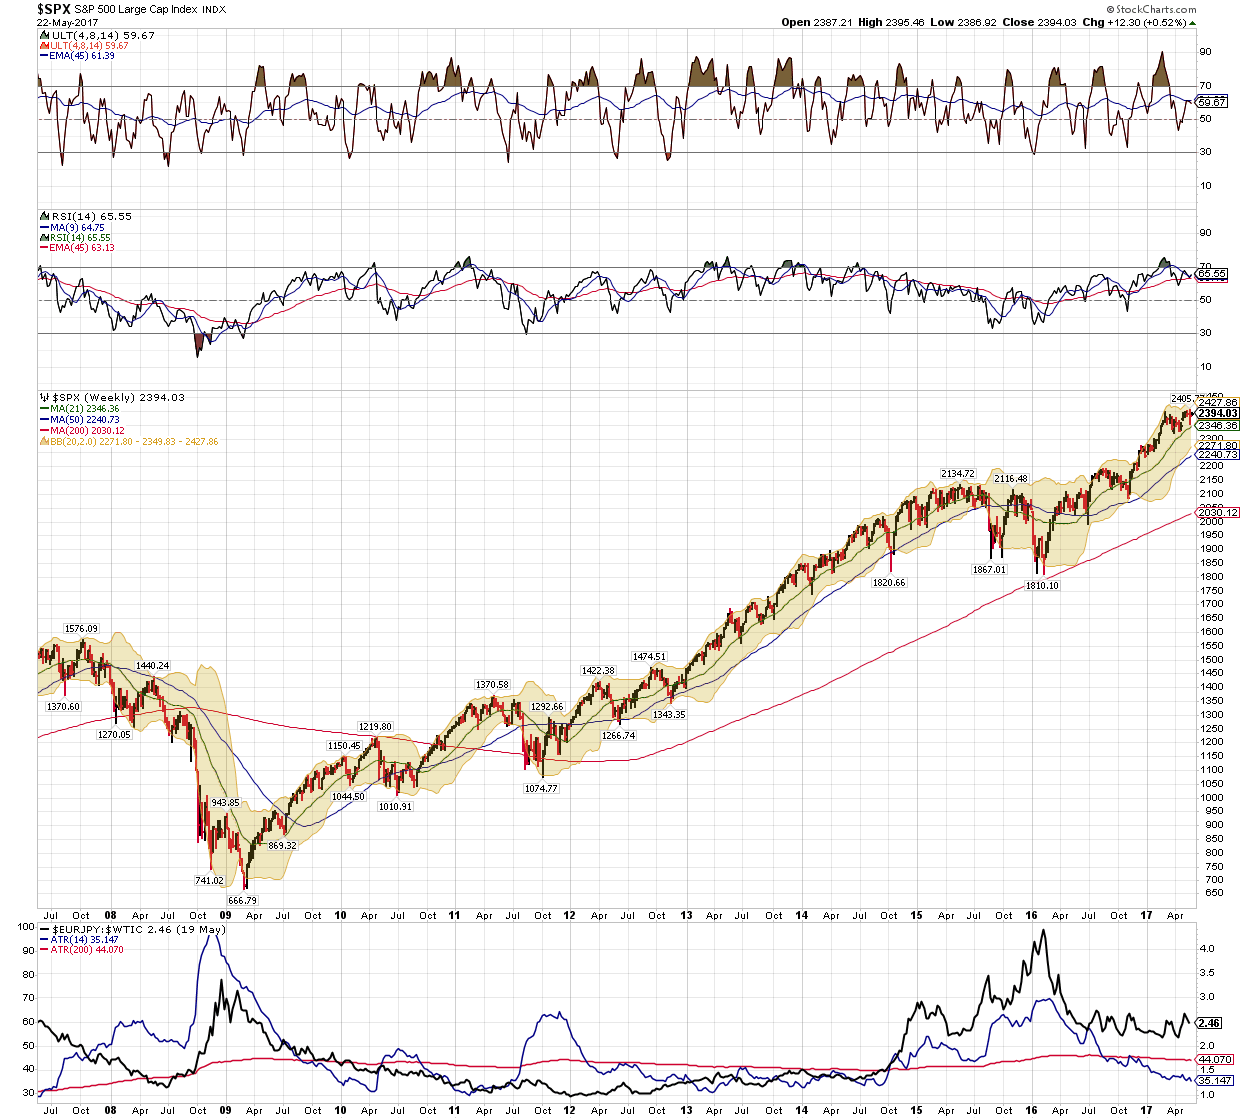
Here is the my Proprietary SPX JJP ATR cross of the Eur/JPY :$WTIC correlation chart. The methodology
reinforces the case that we experienced a bear market and has a very good track record. I explained how
the chart works in a post on 3/36/17 which I have reposted below the update chart, which has become even more bullish
---
this is my proprietary model that uses the EUR/JPY crossrate and then correlates it to WTIC.... so you
have 4 of the deepest largest markets in the world..... the Eur/JPY "RIsk On Risk Off" proxy then as a ratio
of the single most important global commodity input crude.
I have shown this 2 or 3 times this past 15 months............ but it's just esoteric enough that it does not
get traction in the layman and even the professional traders mind.
and it has had a very good record..... when the 14 week Average true range goes below the long term 200
week average true range with is calculated on the EUR/JPY Crossrate and then divided as a ratio of
$WTIC.... what that calculation in KISS (KEEP it SIMPLE STUPID) is doing is showing when the relative
volatility of 3 of the worlds biggest pricing components stabilizes.... it creates the necessary price
stability in corporate planning models and in Global Macro Institutional Investor Models to expand risk
exposure...that is long US equity exposure.

To Clarify the signals are generated when the Blue 14 period ATR goes below the long term 200 period
Moving average.... and that generates a buy a the Average True Range of the EUR/JPY cross / by WTIC is
coming down.. what is nice about this model is that you can have signals that are in effect for 2 years or so
at a time.
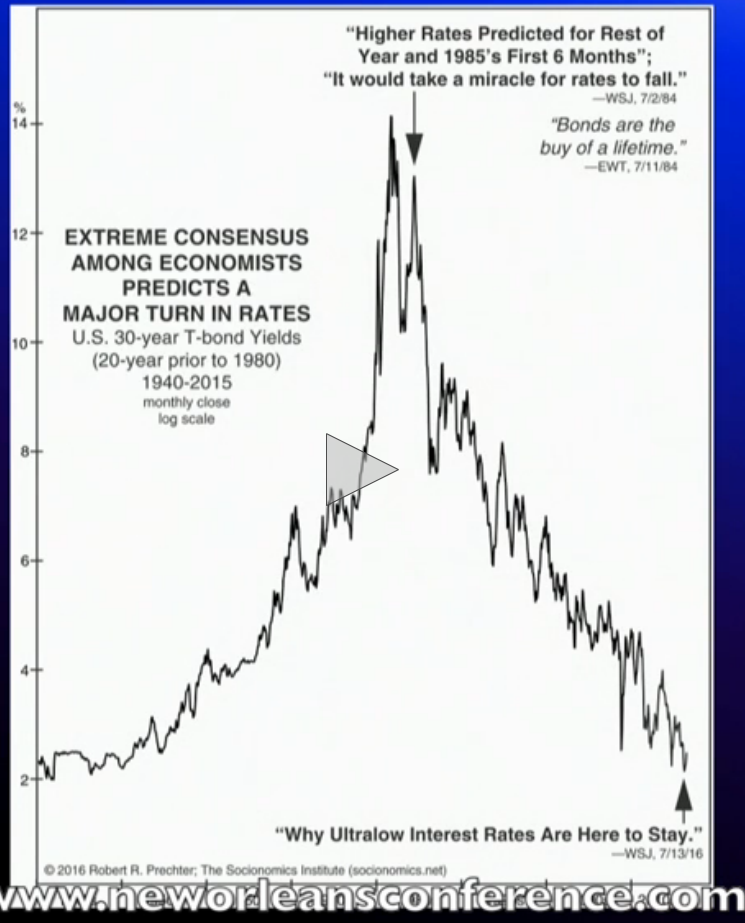
The 72 Year Master Cycle in the US Bond Market
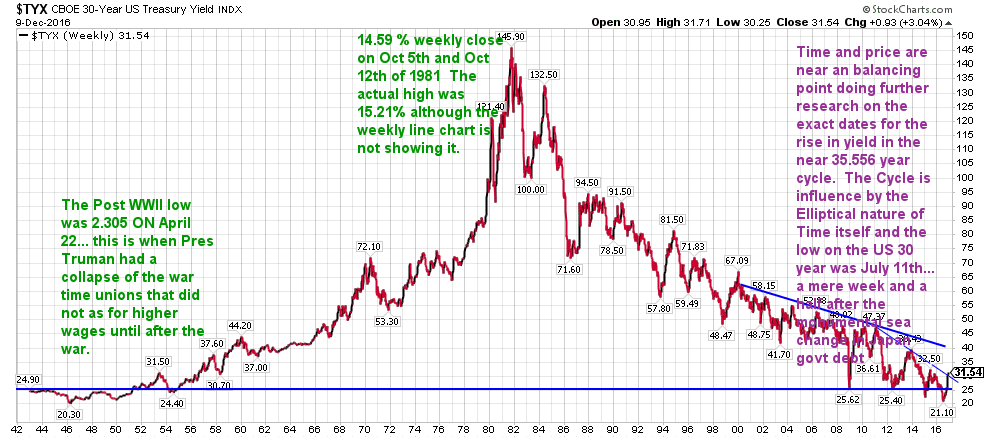
A chart from the Oct 2016 34th presentation at the New Orleans investment symposium
Last Month was the 1 st anniversary of the 3 hour interview of Warren Buffett, Charlie Munger and Bill Gates being interviewed by CNBC squawk box
Message 30694656
But be sure of one thing we are in uncharted waters...of pretty serious magnitude.
When Warren Buffet, Charlie Munger and Bill Gates were interviewed on CNBC back at the time of this years Berkshire annual meeting.... The 3 of them were commented that they would ponder what this development of 12 Trillion dollars of Negative Yield Sovereign Debt and the concomitant low yields on other debt instrumets meant to the financial system.. They said they were not Macro economists and did not know.
They did comment that they wondered if we had gotten into a box that we would never be able to get out of... I found it remarkable that you have Munger a 91 year old and Buffett at 86 actually falling even a bit susceptible to the idea that things would remain as they are indefinitely...... They have too much life experience to believe that.I will add that you need that psychological capitulation even among the Charlie Munger's to make the Supertanker tops and Bottoms.
read the above post to see my comment on clueless 3 of the smartest investment minds in the world were as to were the end of negative yields would be...... It's like that at turning points.
| To: robert b furman who wrote (18184) | 5/2/2016 9:32:05 AM | | From: John P | 1 Recommendation of 19159 | | Negative interest rates was the first Non Berkshire topic that Bill Gates mentioned when on cnbc with Charlie Munger and Warren Buffett.
I was curious to see what Munger would have to say... he said he does not know what it means.... and how long it would last.
Interesting interviews. It was obvious that they did not give their real thoughts as to a couple of the questions.
Everyone is impressed with AMZN... it's an amazing company.
John |
Message 31077202
All companies are not alike and NVDA or ISRG performance and prospects the past several years are
diametrically opposed to a legacy company like GE or IBM.
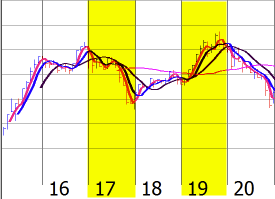
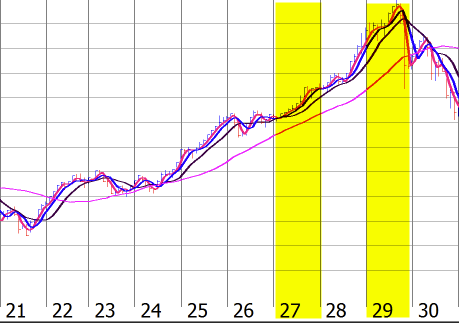
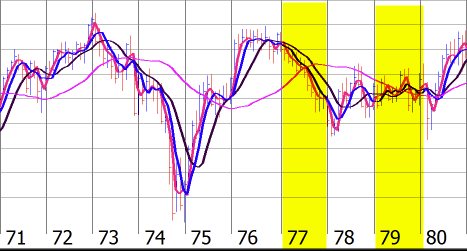
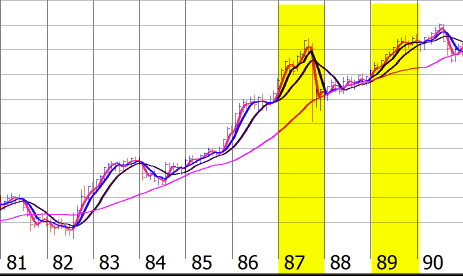
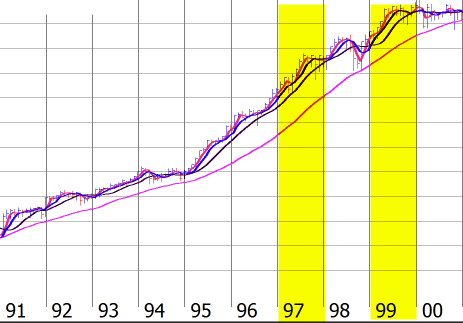
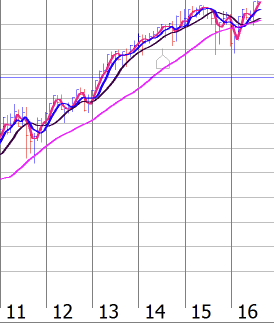
7th & 9th Years of the Decennial Pattern
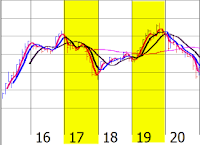

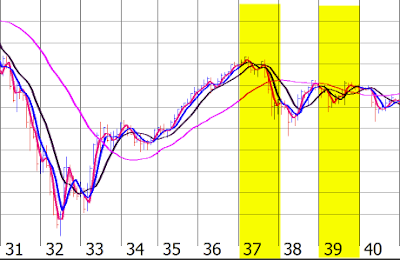
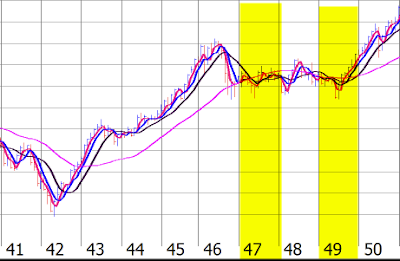
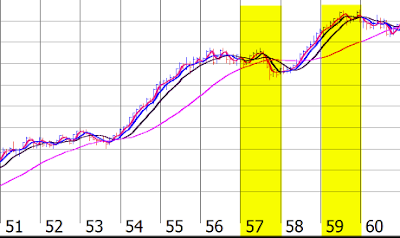
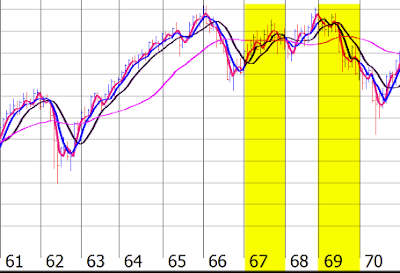
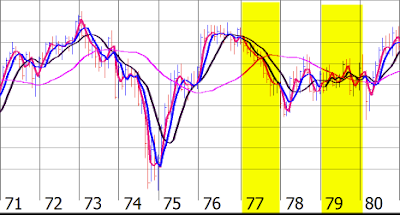
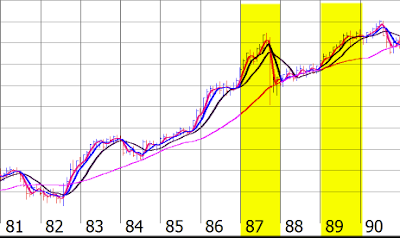
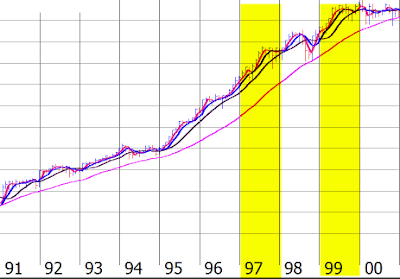

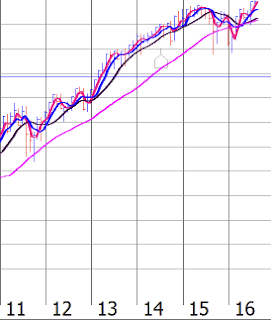
The above charts start from 1915 and go to the current year 2016.
Each decade is shown separately. As you can see the 7th and 9th years have been highlighted in yellow.
The reason for this was to show that highs have been made in the 7th and 9th years of a decade.
In some cases a high was made in the 6th year as in 1916-17, 1946, 1956-57, 1966 and 1976-77.
Since the current bull market which started in 2009 is 8 plus years mature, it is likely that 2017 & 2019 may put a damper on the bull and give way to another bear market.
------------------------------------------------------
So we have yields going down and stocks zooming up..... at least the NDX top dogs are doing it.... but we know that it's a long and winding road.
More... on this to come, oh yes and one last thing to ponder.... being in the long bond as an investor over the past 20 years made your 86% more on your money than being in the SPX 500 that was as of Late Sept of 2016......
Message 30754163
And The Cryptocurrency Bull Market Mania is illustrative of the Massive Global liquidity Pump.....
Bitcoin, Ethereum... and the growing field of over 200 cryptocurrencies is introducing the democratization
of the ability to create your own Central Bank and join in the game with at the Big Boy Pants .... at our
2017 Texas No Hold' em Global Liquidity Festival.
New developments on the Singularity ...... A. I. -- Inferencing and the Global Financial Marketplace.
grab a front row seat...... buy the ticket and take the ride.......
JJP |