The GFA EUR/JPY:$WTIC ratio ATR 14/200 SPX weekly Global Liquidity and cost of Volatility in the World's 4 largest and Deepest Markets.
Over the coming 2-3 days I will repost all of the previous posts that have discussed the system, provide links to the real time post that demonstrate the accuracy of the system, as well as explain (again) exactly why monitoring these largest global markets logically impacts nearly all additional markets.. It is so logical
and easy to understand that several of our really sharp market shops have already set up this system and
several tweaks.. as this system is the anthesis of a black box system an can be totally modeled.
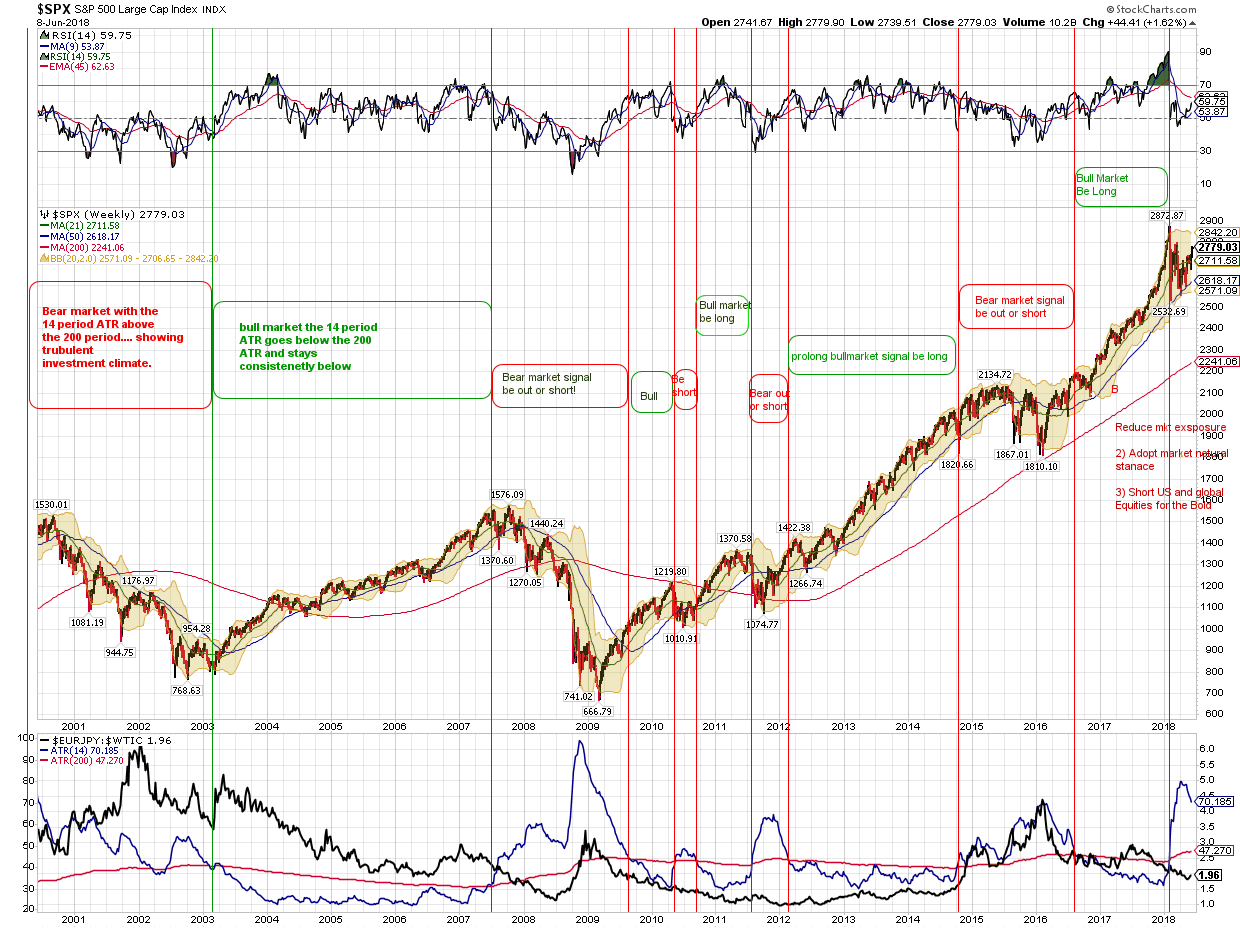
This is not a theoretical model.... It has been written about, explained in detail and has had an enviable
real time performance history over the past 18 months....... I suppose I shall need to post all of the previous links for those who are not up to speed as to the live time performance record, as well as the
detailed analysis as why this global macro model has such gravitas imbued in it's construction.
We at GFA had sold several options to have a 90 day quiet period and not publicly discuss the model when it generated it's latest sell signal in the first weeks of February....our partners did not want to
draw any additional attention to the sell signal as the equity and derivatives markets had created a quite
a vacuum in leveraged short option volatility contracts and products..... and thus it was to the detriment said aligned interests to create any greater a spotlight on the squeeze in those who had sold excessive
volatility derivatives on equities.
-------------------------------------------------------------------------------------------
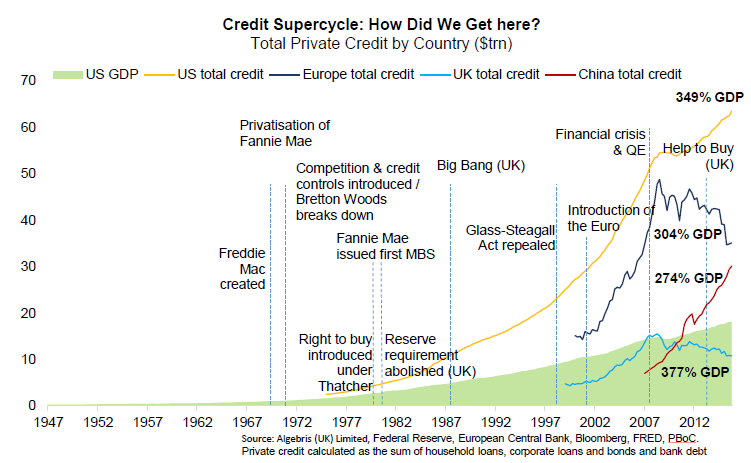
The Credit SuperCycle as presented on the World Economic Forum website
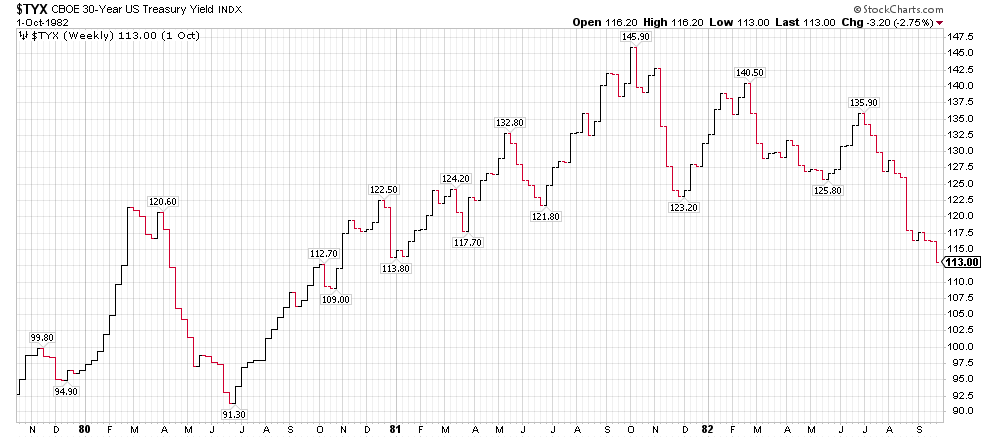
The 72 year master cycle in the US 30 year Treasury bond --- The US entered a secular bull market in yield (interest rates are going higher) and bear market in bond prices on July 8 2016. We are now in the
wave of advance that the general Wall street and global financial community comes to the mass realization
that interest rates are going up.

THE 30 YEAR US TREASURY BOND WEEKLY CHART FROM LATE 1979 TO SEPTEMBER 1982
THE High in Yield was 14.59% on Oct 12 1981.
we have a number of global central banks taking steps to normalize interest rates, which means to raise them and since we have had 8 years of global Zero interest rate policy, on short rates in the US, the ECB, the BOJ, the SNB - swiss national bank, the swedish Riskbank, the BOE was very accomodative...
and so it's a brave new world of the reduction of monetary stimulus and we have already had 3 or 3 Fed Fund increases here in the US.... are we up to 4 already? We have another coming in Dec.
and we have never seen the global central banks in this position, We have the FED, the Bank of England, the Reserve Bank of Australia, the central bank of Canada, and the European Central bank all in tightening
mode....... .. they have never been in this position and in central banking land.... mistakes in the movement of the short term borrowing rates can occur, especially when you have multiple countries doing the same thing... It sets up uncertainty in the Long dated FX market.... creates uncertainty for Banking, Insurance, Reinsurance companies as to how to hedge and value their long dated commitments.
Endowments, pension funds , soverign wealth funds are also all impacted by this grand experiment.
as Hyman Minsky famously said "stability is Destabilizing" that has always been the case and
will always be the case...we have been through a long period of stability which has let lots of all of the
above market participants, companies, hedge funds.... take advantage of very cheap credit by issuing a vast
ocean of it.... we shall find out who is over levered..... and then their are exogenous shocks and black swan
events. |


