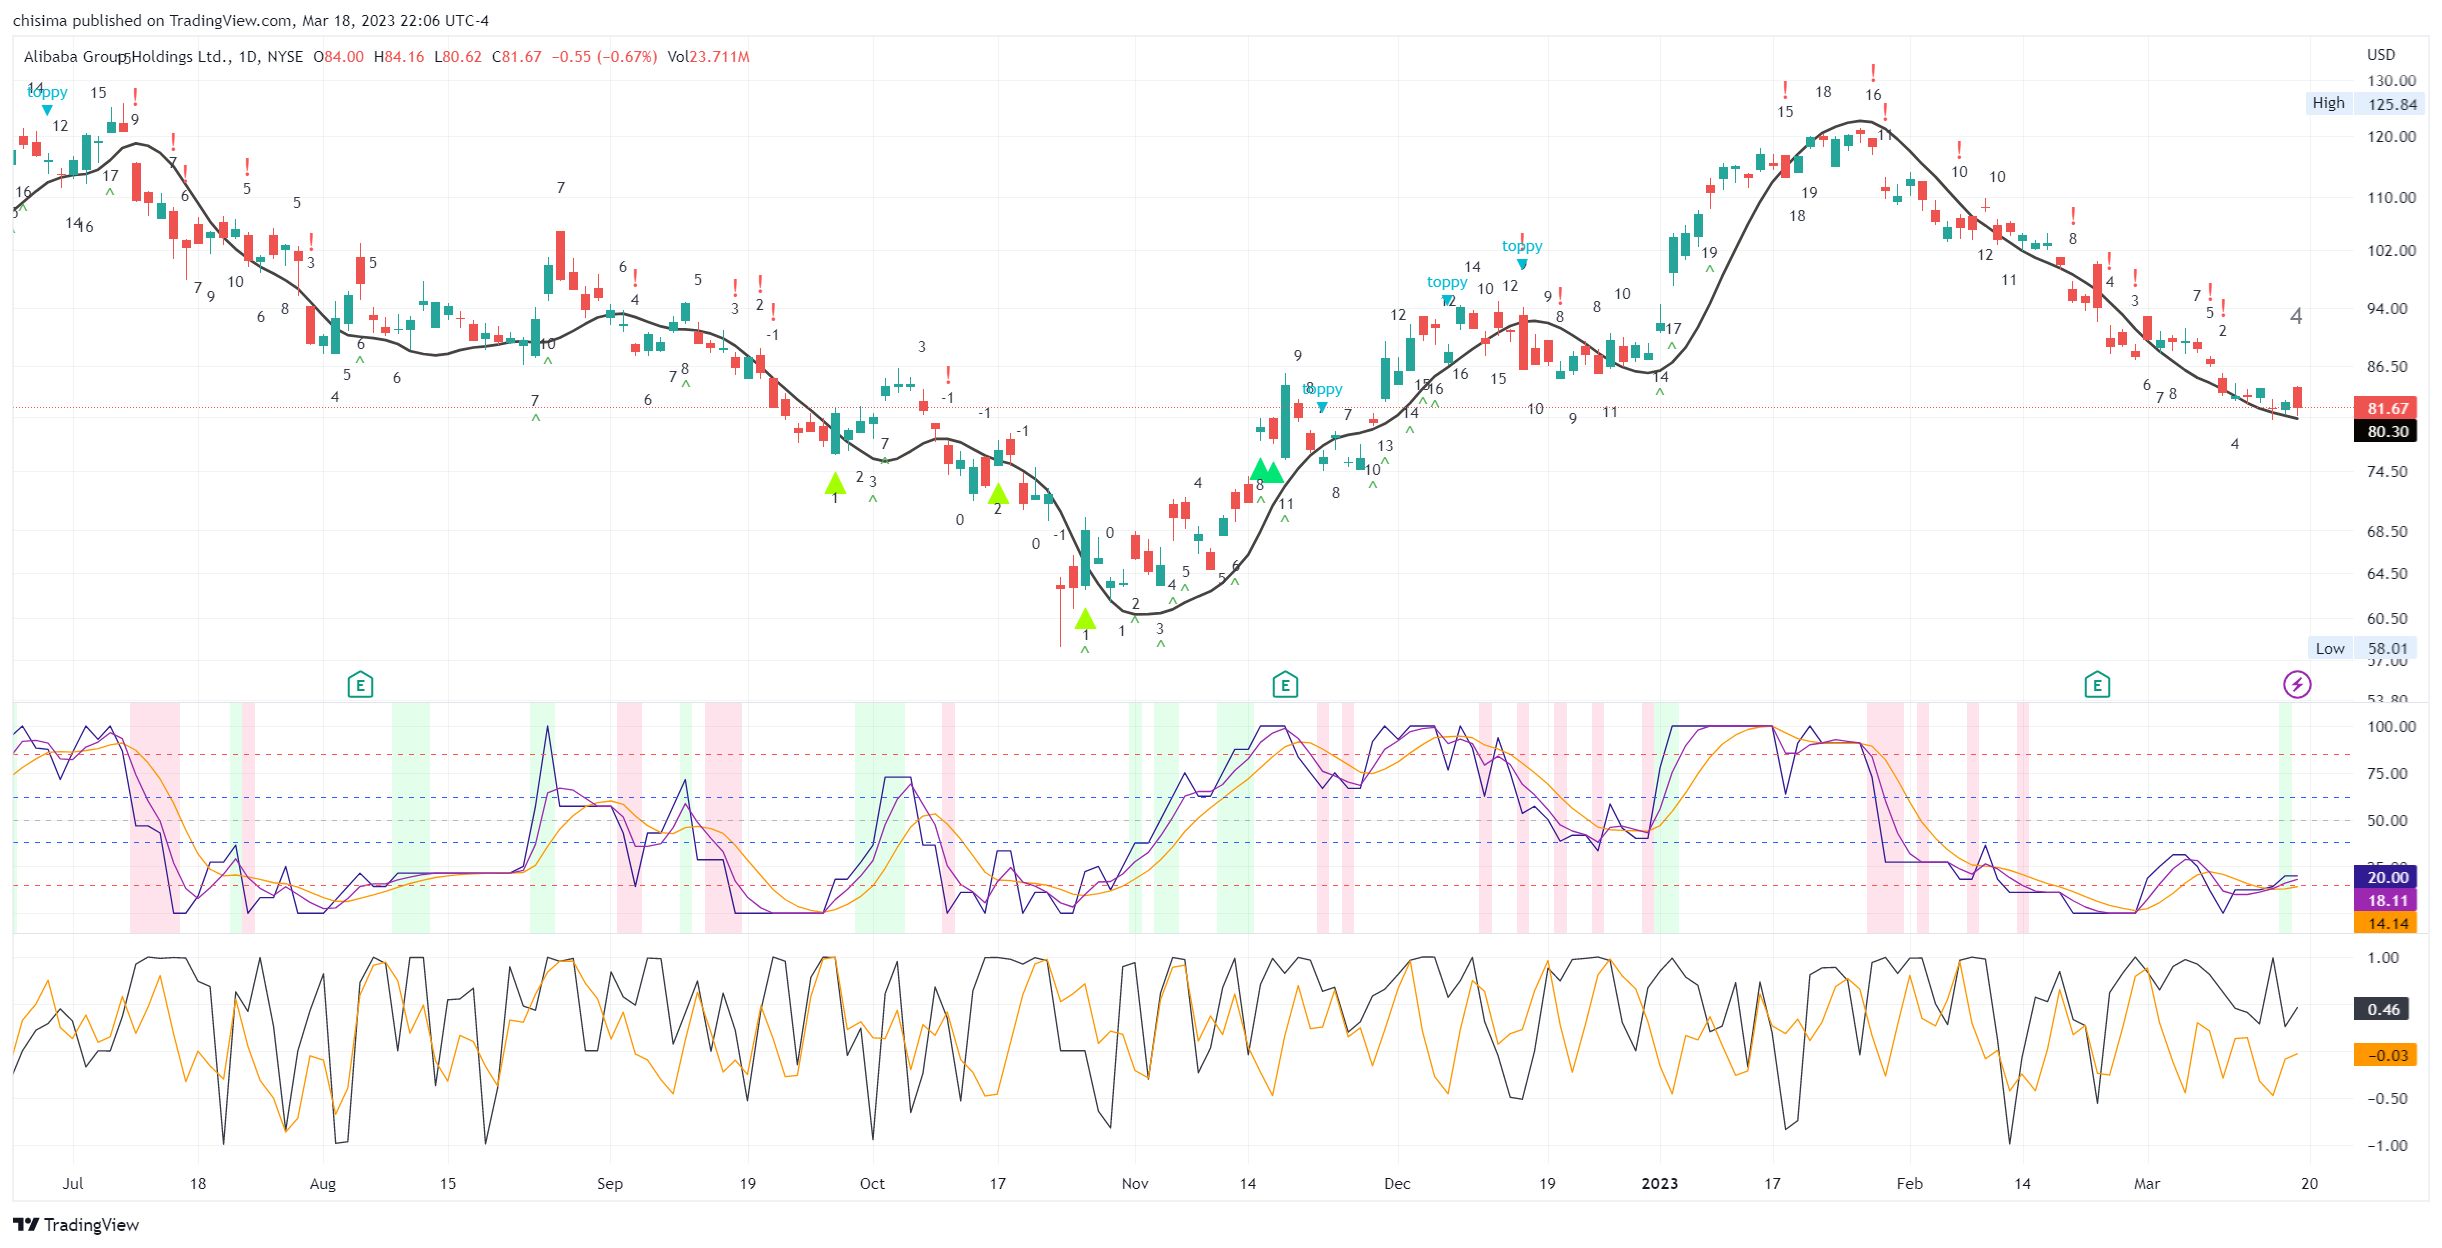
This week I went on a binge coding spree to finish implementing an algo that has been in the works for quite a while. TL;DR, I analyze changes in positions to see if they match a bullish hypothesis. The algo is a pretty good detective. In the chart below, I show the internal metrics of a stock's position score each time it changes. Near the tops, you see a disproportionately negative change in the score whereas at bottoms the opposite happens. I'm including BABA's chart below and more examples (of oil, TSLA, AMZN, Russell 2000, etc across various timeframes) are presented here: Message 34227952
In the chart below, at the top in July, BABA's score went from 17 to 9 in one bar without moving much! In the November bottom, it's score went from -1 to +5 again without going anywhere. This was evidence of position changes. And finally, in the recent top in February, it went from 18 to 11.
If someone has had a surprising trade and wants me to run the algo on it, I'll be happy to do so.
 |


