SI
SI
discoversearch

We've detected that you're using an ad content blocking browser plug-in or feature. Ads provide a critical source of revenue to the continued operation of Silicon Investor.  We ask that you disable ad blocking while on Silicon Investor in the best interests of our community.  If you are not using an ad blocker but are still receiving this message, make sure your browser's tracking protection is set to the 'standard' level.
Technology Stocks : Daily Technical Analysis (Elliotwave)

 Public ReplyPrvt ReplyMark as Last ReadFilePrevious 10Next 10PreviousNext  
From: more1001/27/2016 3:05:38 AM
   of 37
 
Today's Best Large Caps --

XEL $WEG SO $O NI

Today as I write this article most stocks are still trading below their 20, 50 and 100 day moving averages. Right now the percentage trading above their DMA's are:

19.09% - 20 DMA
13.63% - 50 DMA
16.97% - 100 DMA
The stocks listed today are by no means a buy list, they are just the stocks that came up in my screener. This morning I used Barchart to sort the S&P 500 Large Cap Index stocks for the ones with the highest technical buy signals. Personally, I don't buy unless both the market and the individual stocks have buy signals. Right now although a few individual stocks have buy signals the market as a whole is still trading below its daily moving averages.

Today's list includes XCEL Energy (XEL), Wisconsin Energy (WEC), Southern Company (SO), Realty Income (O), and NiSource (NI):

XCEL Energy (XEL)


Barchart technical indicators:
100% technical buy signals
Trend Spotter buy signal
Above its 20, 50 and 100 day moving averages
8 new highs and up 3.53% in the last month
Relative Strength Index 57.73%
Technical support level at 36.07
Recently traded at 36.98 with a 50 day moving average of 35.84
Wisconsin Energy (WEC)


Barchart technical indicators:
100% technical buy signals
Trend Spotter buy signal
Above its 20, 50 and 100 day moving averages
5 new highs and up 5.02% in the last month
Relative Strength Index 62.67%
Technical support level at 52.58
Recently traded at 54.11 with a 50 day moving average of 50.88
Southern Company (SO)


Barchart technical indicators:
100% technical buy signals
Trend Spotter buy signal
Above its 20, 50 and 100 day moving averages
6 new highs and up 1.95% in the last month
Relative Strength Index 62.60%
Technical support level at 46.90
Recently traded at 47.94 with a 50 day moving average of 45.94
Realty Income (O)


Barchart technical indicators:
100% technical buy signals
Trend Spotter buy signal
Above its 20, 50 and 100 day moving averages
11 new highs and up 7.50% in the last month
Relative Strength Index 68.41%
Technical support level at 52.96
Recently traded at 55.15 with a 50 day moving average of 50.81
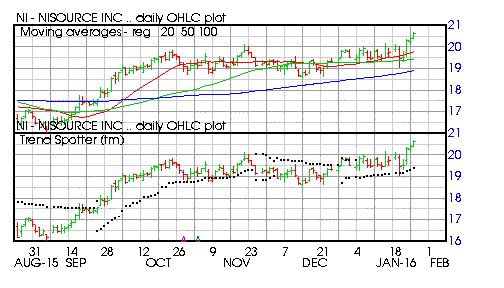
NiSource (NI)


Barchart technical indicators:
100% technical buy signals
Trend Spotter buy signal
Above its 20, 50 and 100 day moving averages
9 new highs and up 6.53% in the last month
Relative Strength Index 63.03%
Technical support level at 20.01
Recently traded at 20.52 with a 50 day moving average of 19.44
Report TOU ViolationShare This Post
 Public ReplyPrvt ReplyMark as Last ReadFilePrevious 10Next 10PreviousNext