 |
 | |
 |  |
| We've detected that you're using an ad content blocking browser plug-in or feature. Ads provide a critical source of revenue to the continued operation of Silicon Investor. We ask that you disable ad blocking while on Silicon Investor in the best interests of our community. If you are not using an ad blocker but are still receiving this message, make sure your browser's tracking protection is set to the 'standard' level. |

The Chart of the Day belongs to PBF Energy ($PBF). I found the petroleum refining stock by using Barchart to sort today's New High list for the highest number of new highs in the last month then used the Flipchart feature to review the charts. Since the Trend Spotter signaled a buy on 10/1 the stock gained 29.71%. Barchart technical indicators: 100% Barchart technical buy signals Trend Spotter buy signal Above its 20, 50 and 100 day moving averages 16 new highs and up 34.67% in the last month Relative Strength Index 76.01% Barchart computes a technical support level at 38.91 Recently traded at 40.78 with a 50 day moving average of 32.66 Fundamental factors: Market Cap $3.91 billion P/E 8.48 Dividend yield 2.99% Revenue expected to decline 33.30% this year but increase again by 19.70% next year Earnings estimated to decrease 11.50% this year but increase again by 12.00% next year and continue to compound at an annual rate of 7.85% for the next 5 years The Wall Street analysts are all over the map with 5 strong buy, 3 buy, 5 hold, 1 under perform and a sell recommendation. 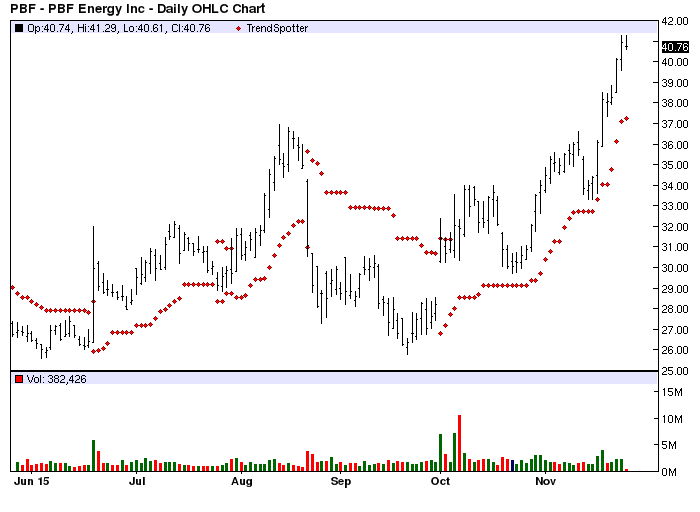
| ||||||||||||||
|

| Home | Hot | SubjectMarks | PeopleMarks | Keepers | Settings |
| Terms Of Use | Contact Us | Copyright/IP Policy | Privacy Policy | About Us | FAQ | Advertise on SI |
| © 2026 Knight Sac Media. Data provided by Twelve Data, Alpha Vantage, and CityFALCON News |