SI
SI
discoversearch

We've detected that you're using an ad content blocking browser plug-in or feature. Ads provide a critical source of revenue to the continued operation of Silicon Investor.  We ask that you disable ad blocking while on Silicon Investor in the best interests of our community.  If you are not using an ad blocker but are still receiving this message, make sure your browser's tracking protection is set to the 'standard' level.
Technology Stocks : Daily Technical Analysis (Elliotwave)

 Public ReplyPrvt ReplyMark as Last ReadFilePrevious 10Next 10PreviousNext  
From: more1004/19/2016 4:07:35 AM
   of 37
 
5 NASDAQ 100 Stocks for Momentum Investors --
GILD $CTXS NVDA $LLTC CMCSA

Today I used Barchart to sort the NASDAQ 100 Index stocks first for the most frequent new highs in the last month, then again for technical buy signals of 80% or more. Next I used to Flipchart feature to review the charts for consistency. Today's additions to the watch list include:


Gilead Sciences (GILD), Citrix Systems (CTXS), Nvidia (NVDA), Linear Technologies (LLTC) and Comcast A (CMCSA)


Gilead Sciences (GILD)


Barchart technical indicators:

88% technical buy signals

Trend Spotter buy signal

Above its 20, 50 and 100 day moving averages

10 new highs and up 4.33% in the last month

Relative Strength Index 61.99%

Technical support level at 60.90

Recently traded at 61.67 with a 50 day moving average of 59.47


Citrix Systems (CTXS)


Barchart technical indicators:

100% technical buy signals

Trend Spotter buy signal

Above its 20, 50 and 100 day moving averages

10 new highs and up 4.66% in the last month

Relative Strength Index 64.61

Technical support level at 78.68

Recently traded at 79.83 with a 50 day moving average of 73.80


Nvidia (NVDA)


Barchart technical indicators:

96% technical buy signals

Trend Spotter buy signal

Above its 20, 50 and 100 day moving averages

10 new highs and up 9.44% in the last month

Relative Strength Index 75.10%

Technical support level at 36.35

Recently traded at 36.91 with a 50 day moving average of 43.50


Linear Technology (LLTC)


Barchart technical indicators:

88% technical buy signals

Trend Spotter buy signal

Above its 20, 50 and 100 day moving averages

9 new highs and up 2.74% in the last month

Relative Strength Index 57.69%

Technical support level at 44.61

Recently traded at 44.90 with a 50 day moving average of 43.50


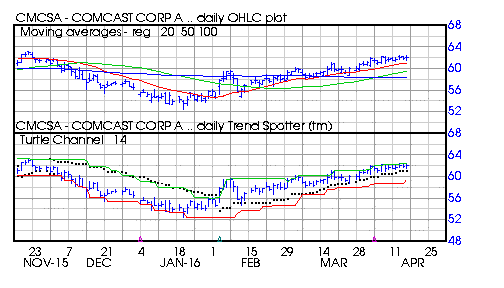
Comcast A (CMCSA)


Barchart technical indicators:

88% technical buy signals

Trend Spotter buy signal

Above its 20, 50 and 100 day moving averages

9 new highs and up 4.33% in the last month

Relative Strength Index 61.99%

Technical support level at 60.90


Recently traded at 61.61 with a 50 day moving average of 59.47
Report TOU ViolationShare This Post
 Public ReplyPrvt ReplyMark as Last ReadFilePrevious 10Next 10PreviousNext