SI
SI
discoversearch

We've detected that you're using an ad content blocking browser plug-in or feature. Ads provide a critical source of revenue to the continued operation of Silicon Investor.  We ask that you disable ad blocking while on Silicon Investor in the best interests of our community.  If you are not using an ad blocker but are still receiving this message, make sure your browser's tracking protection is set to the 'standard' level.
Technology Stocks : Daily Technical Analysis (Elliotwave)

 Public ReplyPrvt ReplyMark as Last ReadFilePrevious 10Next 10PreviousNext  
Recommended by:
zax
From: more1002/2/2016 4:51:10 AM
1 Recommendation   of 37
 
Today's 5 Best Large Caps --
XEL $WEC VZ $T STZ


As I write this post the market appears to be bottoming out. I am not saying recovery but I do see a bottom. Right now a slim majority of the 10,000+ stocks in the Barchart data base are trading above their 20 day moving averages. They are:


51.31% above their 20 DMA

23.82% above their 50 DMA

23.65% above their 100 DMA

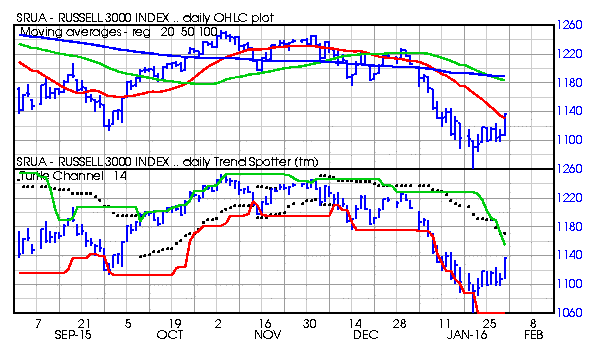
The market cap Russell 3000 Index is also trading off its bottom as this chart of the DMAs and 14 day turtle channel shows:


Today I used Barchart to sort the SP 500 Large Cap Index stocks and these 5 all had 100% technical buy signals:


XCEL Energy (XEL)


Barchart technical indicators:

100% technical buy signals

Trend Spotter buy signal

Above its 20, 50 and 100 day moving averages

10 new highs and up 7.27% in the last month

Relative Strength Index 68.79%

Technical support level at 37.23

Recently traded at 38.44 with a 50 day moving average of 36.03


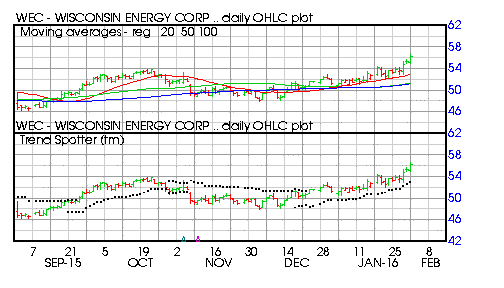
Wisconsin Energy (WEC)


Barchart technical indicators:

100% technical buy signals

Trend Spotter buy signal

Above its 20, 50 and 100 day moving averages

10 new highs and up 10.04% in the last month

Relative Strength Index 71.22%

Technical support level 54.49

Recently traded at 56.30 with a 50 day moving average of 51.31


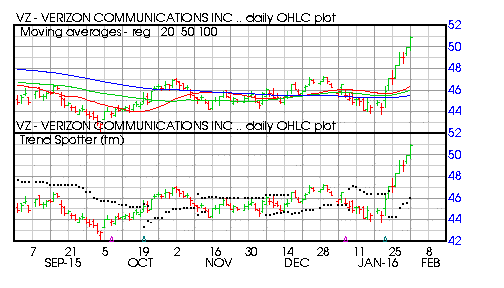
Verizon Communications (VZ)


Barchart technical indicators:

100% technical buy signals

Trend Spotter buy signal

Above its 20, 50 and 100 day moving averages

8 new highs and up 10.23% in the last month

Relative Strength Index 75.82%

Technical support level at 48.96

Recently traded at 50.91 with a 50 day moving average of 46.01


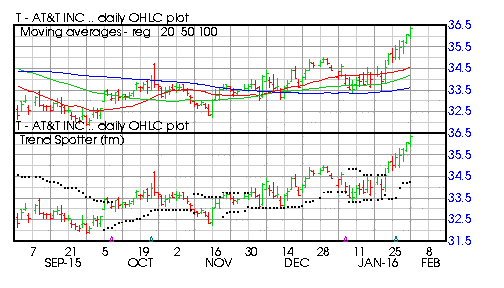
AT&T (T)


Barchart technical indicators:

100% technical buy signals

Trend Spotter buy signal

Above its 20, 50 and 100 day moving averages

9 new highs and up 5.75% in the last month

Relative Strength Index 69.55%

Technical support level at 35.55

Recently traded at 36.35 with a 50 day moving average of 34.19


Constellation Brands (STZ)


Barchart technical indicators:

100% Barchart technical buy signals

Trend Spotter buy signal

Above its 20, 50 and 100 day moving averages

3 new highs and up 8.76% in the last month

Relative Strength Index 67.31%

Technical support level at 150.55


Recently traded at 154.34 with a 50 day moving average of 143.47
Report TOU ViolationShare This Post
 Public ReplyPrvt ReplyMark as Last ReadFilePrevious 10Next 10PreviousNext