SI
SI
discoversearch

We've detected that you're using an ad content blocking browser plug-in or feature. Ads provide a critical source of revenue to the continued operation of Silicon Investor.  We ask that you disable ad blocking while on Silicon Investor in the best interests of our community.  If you are not using an ad blocker but are still receiving this message, make sure your browser's tracking protection is set to the 'standard' level.
Strategies & Market Trends : A.I.M Users Group Bulletin Board

 Public ReplyPrvt ReplyMark as Last ReadFilePrevious 10Next 10PreviousNext  
Recommended by:
Condo
Ken Adams
From: OldAIMGuy4/9/2020 7:55:11 AM
2 Recommendations  Read Replies (1) of 18928
 
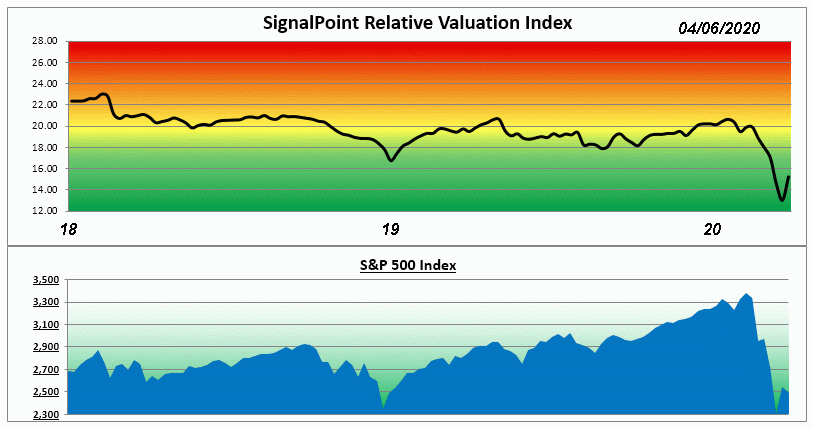
Here's an update on my Market Valuation and Speculation Indexes:


Here we see that the valuation measure seems to have bottomed recently. While it still may tick lower, this low of a level has in the past been an excellent entry point for buying into the general stock market. Value Line's average yield for stocks paying dividends is 3.1% as of last Friday's close. We certainly won't be getting that from 13 Week treasuries for quite some time.

Success History for Relative Valuation Index at various time frames from the start of a Bullish signal:
NASDAQ Average Gain from first Low Risk Signal (1982 to Date)
at 4 Weeks = +2.10%
at 3 Months = +6.13%
at 6 Months = +11.91%
at 9 Months = +16.84%
at 12 Months = +28.9%
--------------------------------------------------------------------------------------------------------------------------------------------

Market Speculation as I measure it also showed a slight bump upward from its severely low risk point.

Note how the Spec Index has a slightly different profile than the Relative Valuation Index but still follows generally the same pattern. These very different statistical measures seem to both agree that the markets were wildly over-sold. Indiscriminate selling of all asset classes during March appears to have set thing up for very tidy gains in the future.

Success History of the Speculation Index at various time frames from the start of a Bullish signal:
NASDAQ Average Gain from first Low Risk Signal (1982 to Date)
at 4 Weeks = -1.84%
at 3 Months = +4.82%
at 6 Months = +9.03%
at 9 Months = +11.92%
at 12 Months = +16.21%

It remains to be seen if we will see better or worse results from these most recent bullish signals.

OAG Tom
Report TOU ViolationShare This Post
 Public ReplyPrvt ReplyMark as Last ReadFilePrevious 10Next 10PreviousNext