SI
SI
discoversearch

We've detected that you're using an ad content blocking browser plug-in or feature. Ads provide a critical source of revenue to the continued operation of Silicon Investor.  We ask that you disable ad blocking while on Silicon Investor in the best interests of our community.  If you are not using an ad blocker but are still receiving this message, make sure your browser's tracking protection is set to the 'standard' level.
Strategies & Market Trends : A.I.M Users Group Bulletin Board

 Public ReplyPrvt ReplyMark as Last ReadFilePrevious 10Next 10PreviousNext  
From: OldAIMGuy6/22/2020 10:52:34 AM
1 Recommendation

Recommended By
Condo

   of 18928
 
v-Wave Reporting Change…………………………

The v-Wave was made available for AIM Users back in late 2007 as a substitute for what was called the i-Wave. Both were developed to monitor ongoing market risk and give a feel for what the near-term future held for AIM investors. (more on the history is available at

investorshub.advfn.com

and

web.archive.org )

It took some time to gather the entire database back to 1982 but was eventually completed. Since then we’ve made a few changes but it’s generally been a stable source of market risk review. Over the years, first ‘Minstrlman’ and later JDerb took on the efforts of reporting the weekly statistics.

JDerb and I were recently reviewing the v-Wave as compared to another famous risk indicator (He-he) and came to the conclusion that the Smoothing Constant we’ve been using to calculate the v-Wave dampens too much of the raw data signal.

The idea of using the smoothed data had been a carry-over from the old i-Wave calculations but this, combined with Value Line’s own data being just Weekly and the internal delay of reporting seems to slow things down a bit too much. Exponential Moving Average calculations do show direction change better than arithmetic M.A.’s but it appears to just be overkill when used on the v-Wave.

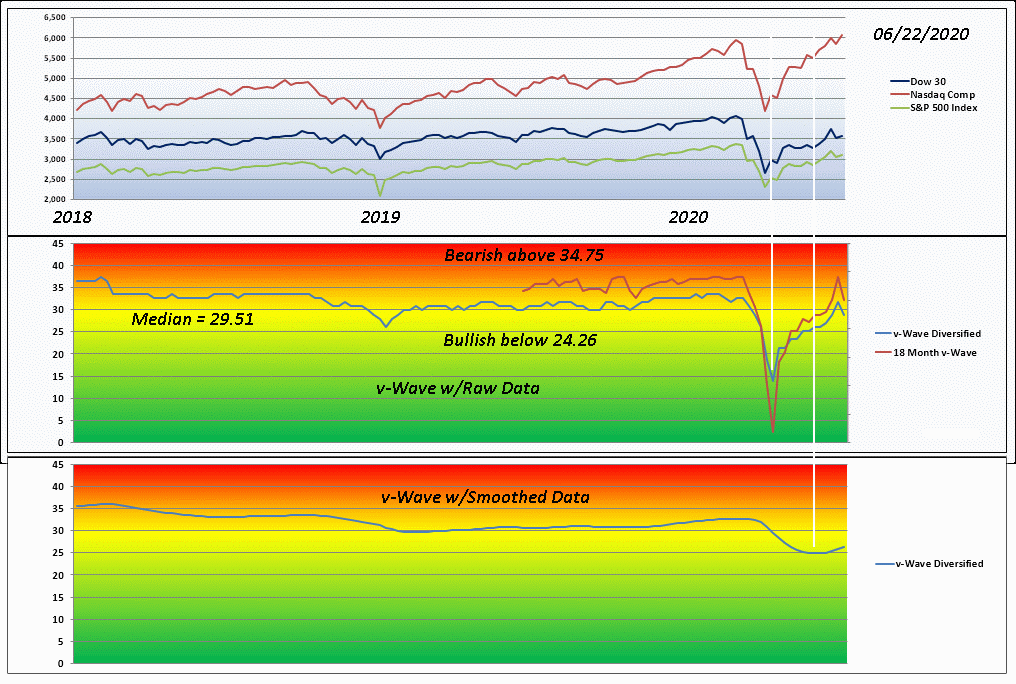
JD and I have decided that from here forward we’ll be reporting the v-Wave with the raw data for both the traditional 3-5 Year and the newer 18 Month time horizons. The Histograms will show the data for the “Diversified” portfolio suggested cash level rather than for the “Stocks.” The “Stocks” data will be reported in the weekly update.

While the v-Wave itself is still based on the same data, we're reporting the weekly data directly. This will make it look more volatile. The use of an exponential moving average vs raw for the data didn't show much difference during times when things were going along steadily but the smoothed data really missed the mark during the recent more volatile markets.


(Smoothed data low was both late and too shallow at around 25% cash, missing the deepest market discounts. Compare that to the Raw data's deep "V" to just 15% suggested cash and timing compared to the market lows.)

The raw data showed the extremes far better than the smoothed. Note that during most of 2019 the difference between Raw and Smooth was incidental. The smoothed data during the Coronavirus outbreak was far too conservative in its cash suggestion compared to the Raw even as we saw the indexes tumble at near record slopes. Value Line's reporting is just weekly, so that already slows things down. The Raw data missed the actual March low by just one week where the Smoothed missed it by three weeks or by about 10% of the early recovery.

So, the data isn't more volatile, just that we're using the weekly raw data instead of a dampened version of the data. In times of extreme speculation or extreme panic we should see a far better representation of actual market events doing it this way. During more modest times like 2019 it will be much the same as before.

Hope this helps,
OAG v-Wave Tom
Report TOU ViolationShare This Post
 Public ReplyPrvt ReplyMark as Last ReadFilePrevious 10Next 10PreviousNext