Below is a 30 year inflation adjusted chart of SPX. Unlike the price chart, you can clearly see the business cycles and valuation ranges. The indicator above it is the SPX itself on a log charts.
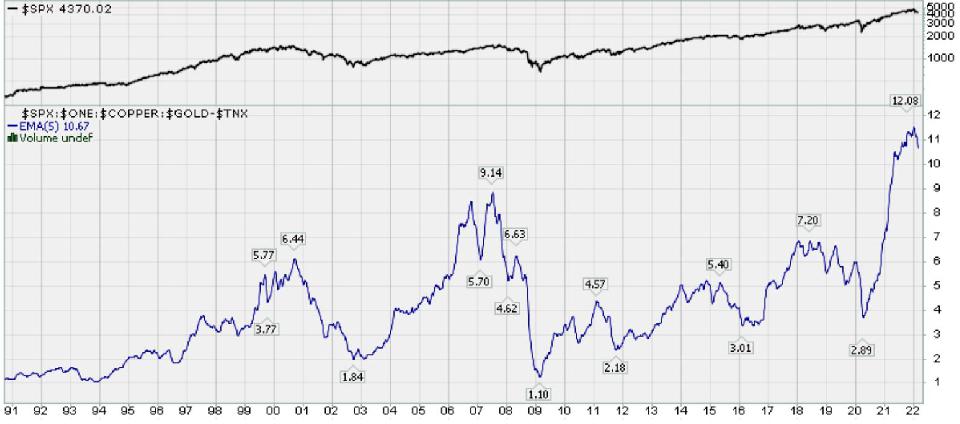
Now we can add some heuristics to this to tell us when the market is getting carried away and we should be on our guard and when it is too fearful and we should be greedy.
Before I continue, you should know that there is no system that provides perfect trading and investing. The market can do anything at any time. So winning is a matter of playing the odds and adjusting your risks. Secondly, for the most parts, you'd be wise to follow the stock market trend, so long as it is not too extreme. This stems from playing the risk/rewards. As we move from one extreme to the other the odds of the trend continuing diminishes.
The framework below is to set the overall expectations to guide your long term (measured in quarters not weeks or days) investment decisions. It is meant to make you money while allowing you to get a good night sleep.
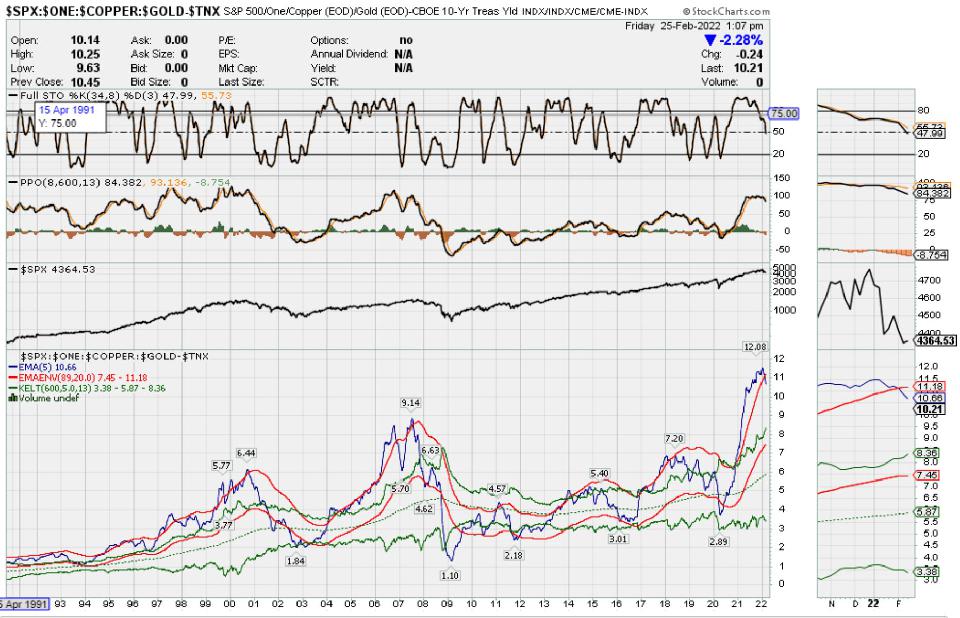
First of all, as the PPO in above chart approaches 100, danger signs should go off in your mind. This by itself is not a deal killer. It needs to be balanced against where the absolute values are. Normal range is 4 +/- 1. As you move above 5, and especially when the blue line goes above the red, an extra warning light should go up in your mind. If you are very risk averse and won't be able to sleep if you face another dot-com crash or housing crash and the like, then this is your exit point. Otherwise, keep in the market so long as the trend is pointing upwards or the stochastics is telling you to.
OK, so where should you buy. First of all, if the price is near or below the lower green line, it is a good time to buy into the market and catch that falling knife. Next entry is when you hit the lower red band, especially if it is pointing upwards. Extra so if the absolute valuations are within normal range (3 - 5). Finally, as before, you can play the trend using bounces off the MA's or the stochastics.
Final caveat - the shorter your timeframe, the higher your risks. You will also be competing against more professionals. The longer timeframes keep you safe.
I am leaving the perm link to the chart so you use it from time to time.
stockcharts.com |


