There are many ways of doing it and each has pros and cons - or rather each is best for a different type of market/stock. for example instead of geometric sequence as I did in my example, you could make an arithmetic progression: 10 shares, 20, 30, etc for every x% drop. Or you could allocate a fix $ amount, which buys you more shares as the prices drop.
What approach you decide on should be a function of the volatility and the expected duration of the trend. If you expect it to be very volatile or get in a prolonged trend, then a geometric sequence is best. Otherwise one of the other approaches.
Below is a 12 year chart of XBI. I set my entry position below its long term trendline. Furthermore, I looked at what the average drawdown from the cyclical peak is and I used that for my 2nd purchase. Normally, I'd use bigger positions and hope to be done with it soon. But we are in a tightening cycle that I expect will go on for several more months. So XBI could be down longer than average. How far down will it go? I don't expect it to go below 5 year lows. Generally speaking I am pretty comfortable buying a major sector or company that is at a 5 year low (again, assuming I see them having a good future. Never buy just because something is down from its highs). That means at worst XBI should bottom somewhere around 40. Given how risk averse the market has become lately and that the Fed is actually at the start of a tightening cycle, then XBI may get there. Of course it is also possible that by the end of the year the Fed starts considering loosening the purse. This uncertainty is why I prefer to schedule this type of purchase based on drawdown rather than a fixed timeline.
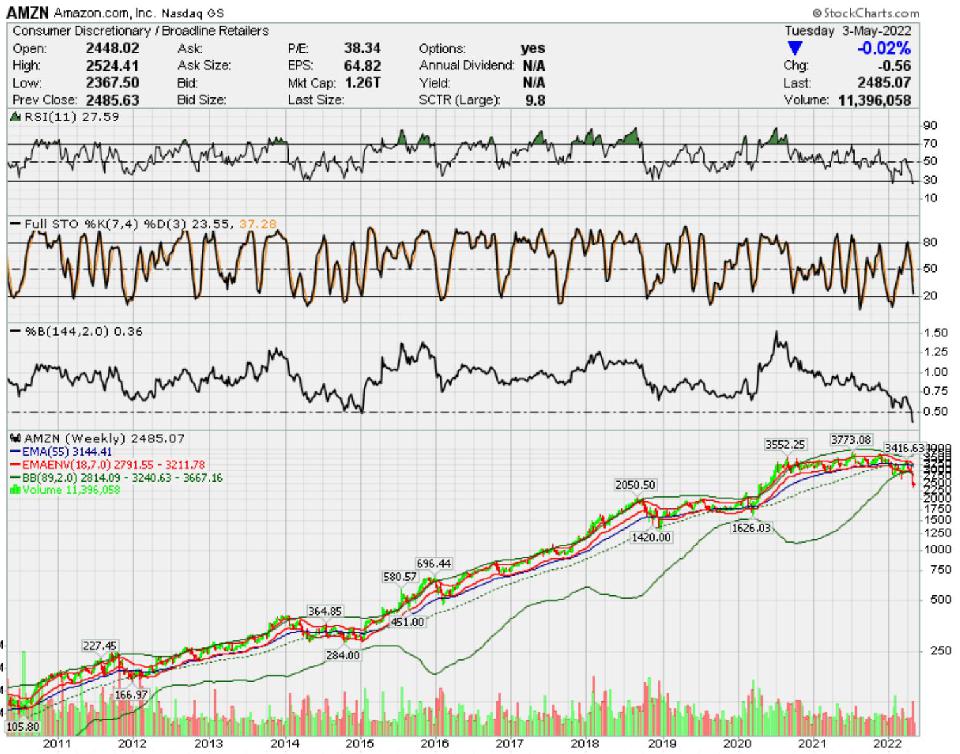
Amazon is another company that I would this with now. Buy one share now, and use either arithmetic or geometric sequence for every 5% - 10% drop (unlike XBI, I don't think Amazon could hit a 5 year low, so my purchase plan is more aggressive).
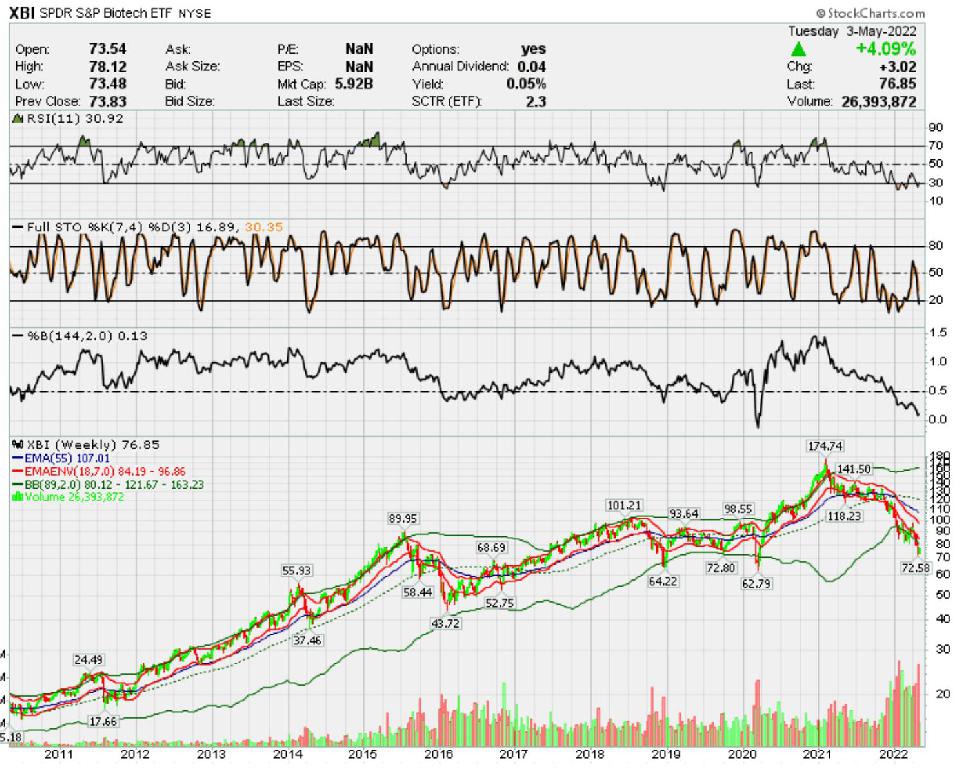
Every stock is different. Compare AMZN below to XBI above.
Based on the RSI and %BB, a case could be made that AMZN should already be an aggressive buy. But given the macro conditions and the market psychology, and the "don't fall in love with the stock" principle, just change the purchase parameters according to the most likely scenario.
 |


