| | | All,
I am thinking of sharing some of the indicators that I have developed. But first, I need to know if there is an interest and if these tools meet your needs and if you will trust them.
Here are the first two under consideration: my personal mods to RSI and the Stochastics.
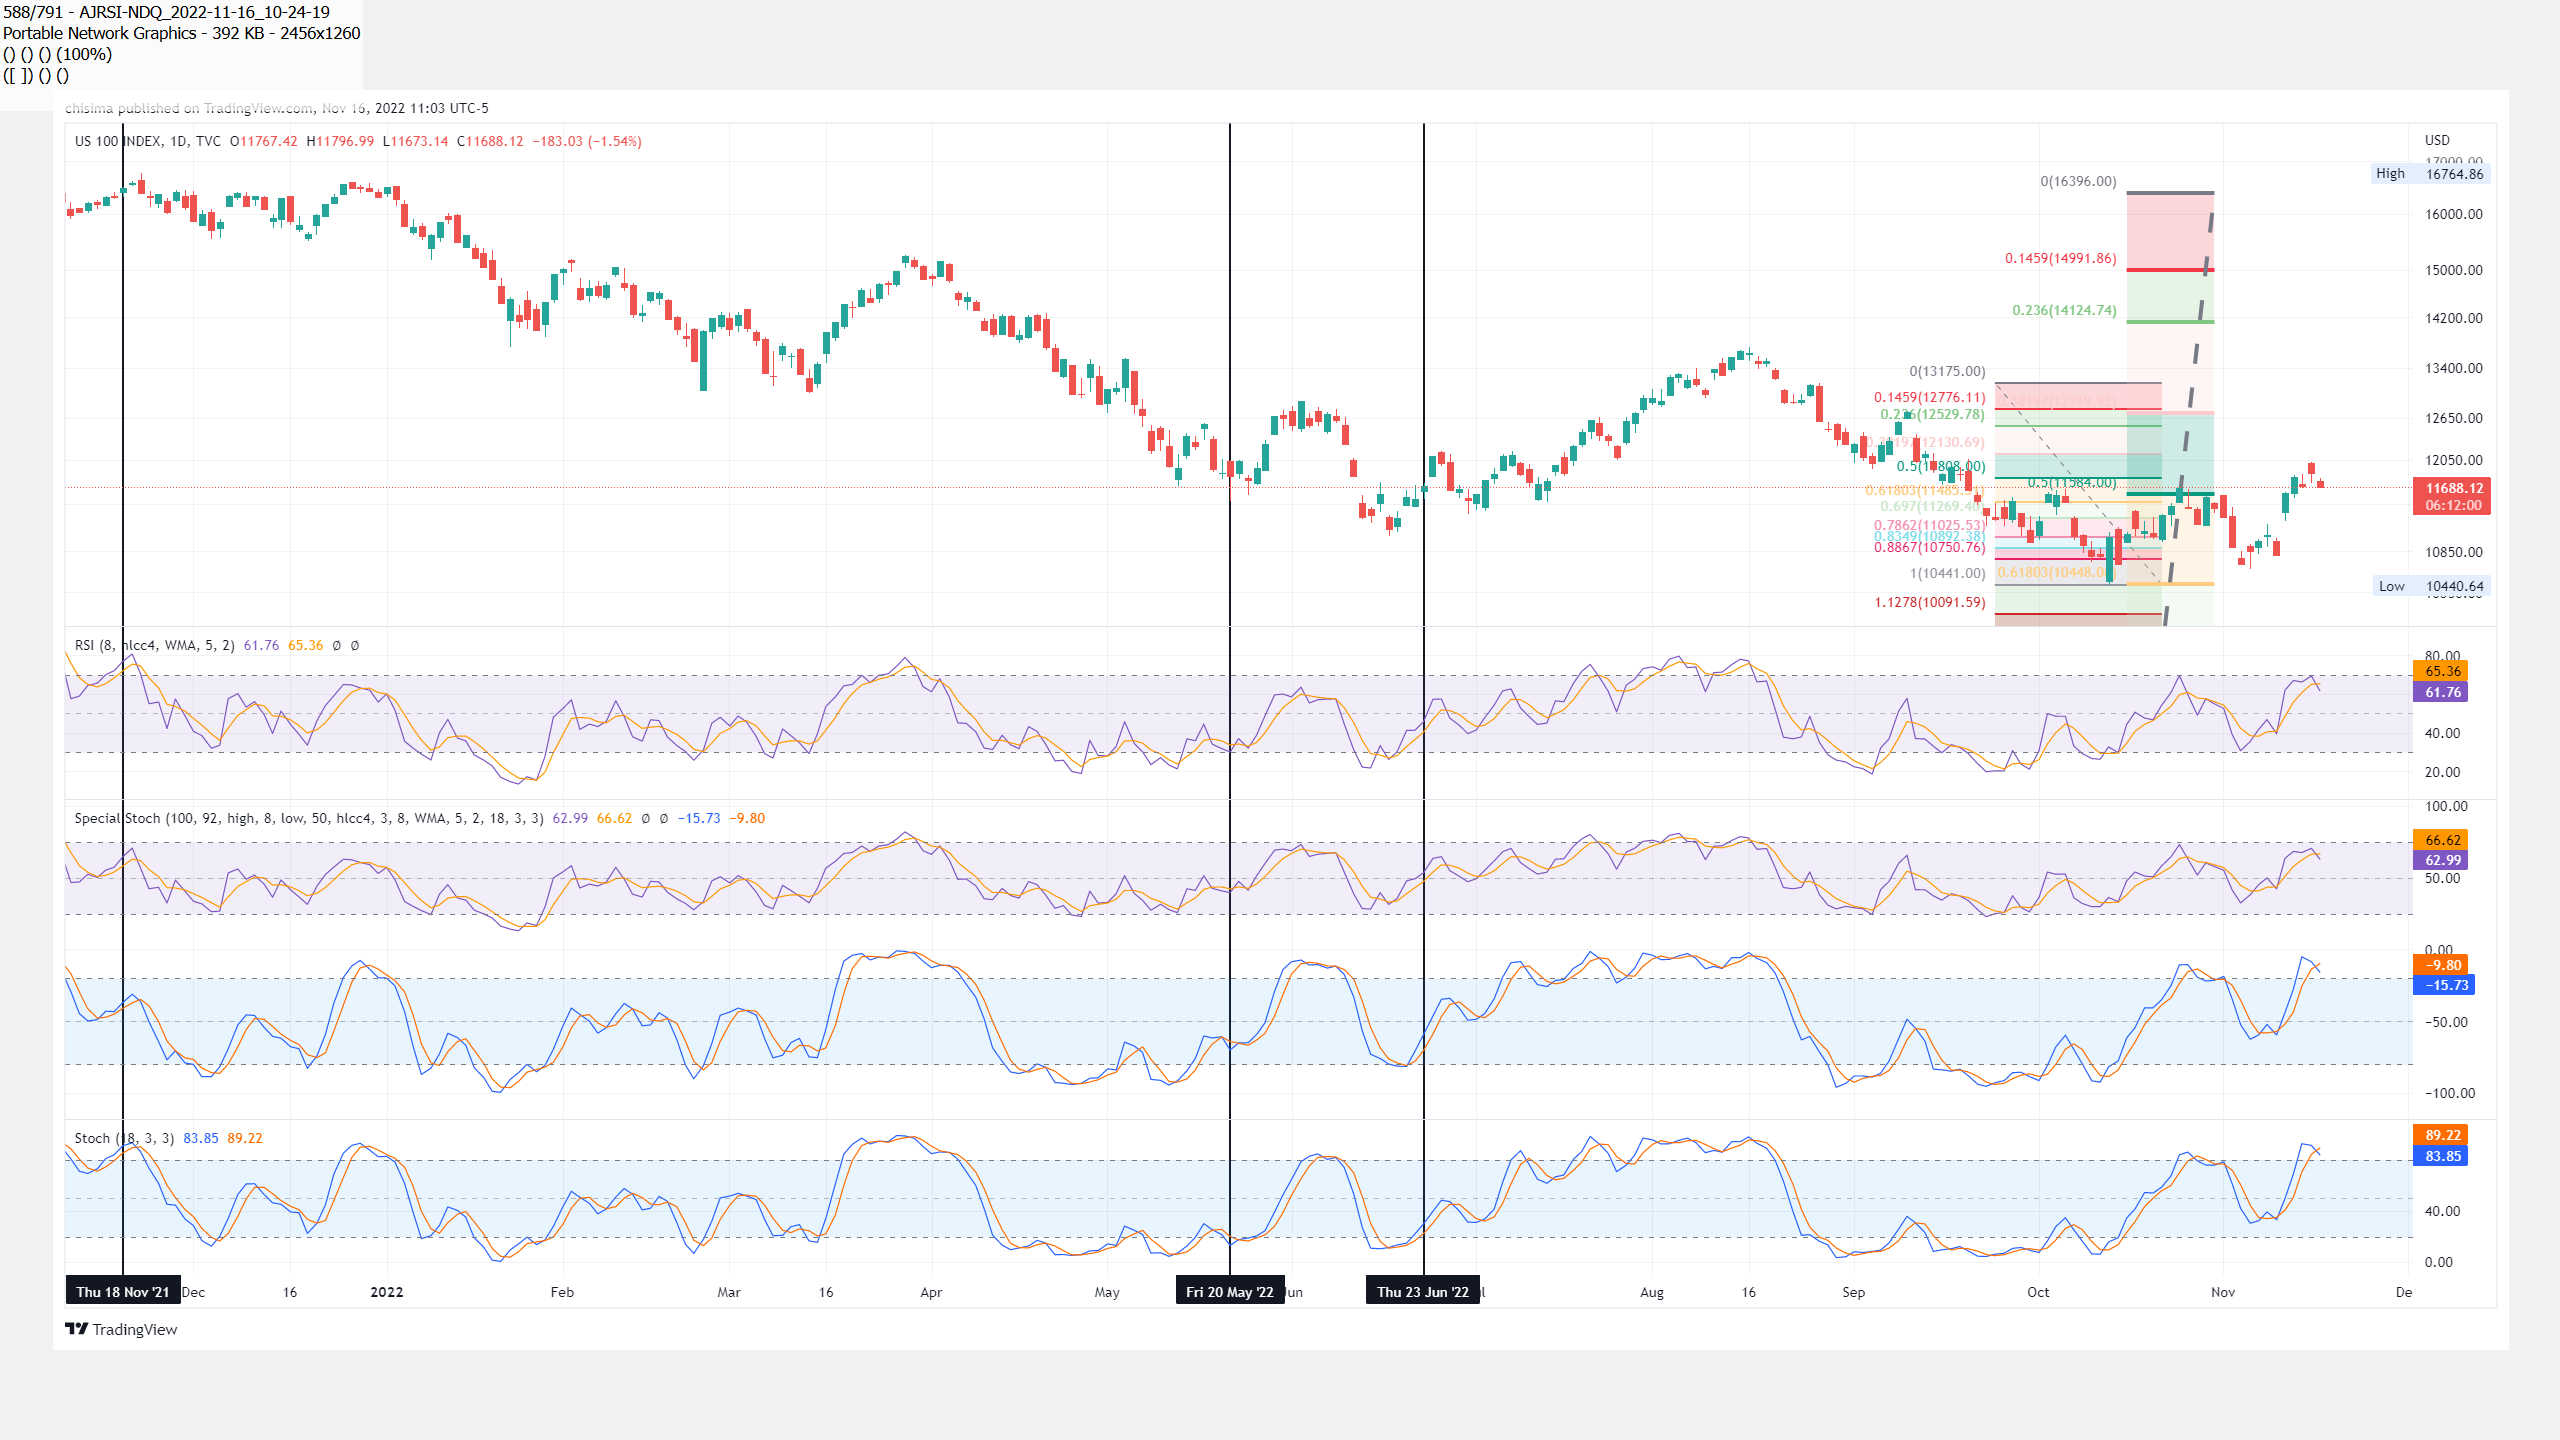
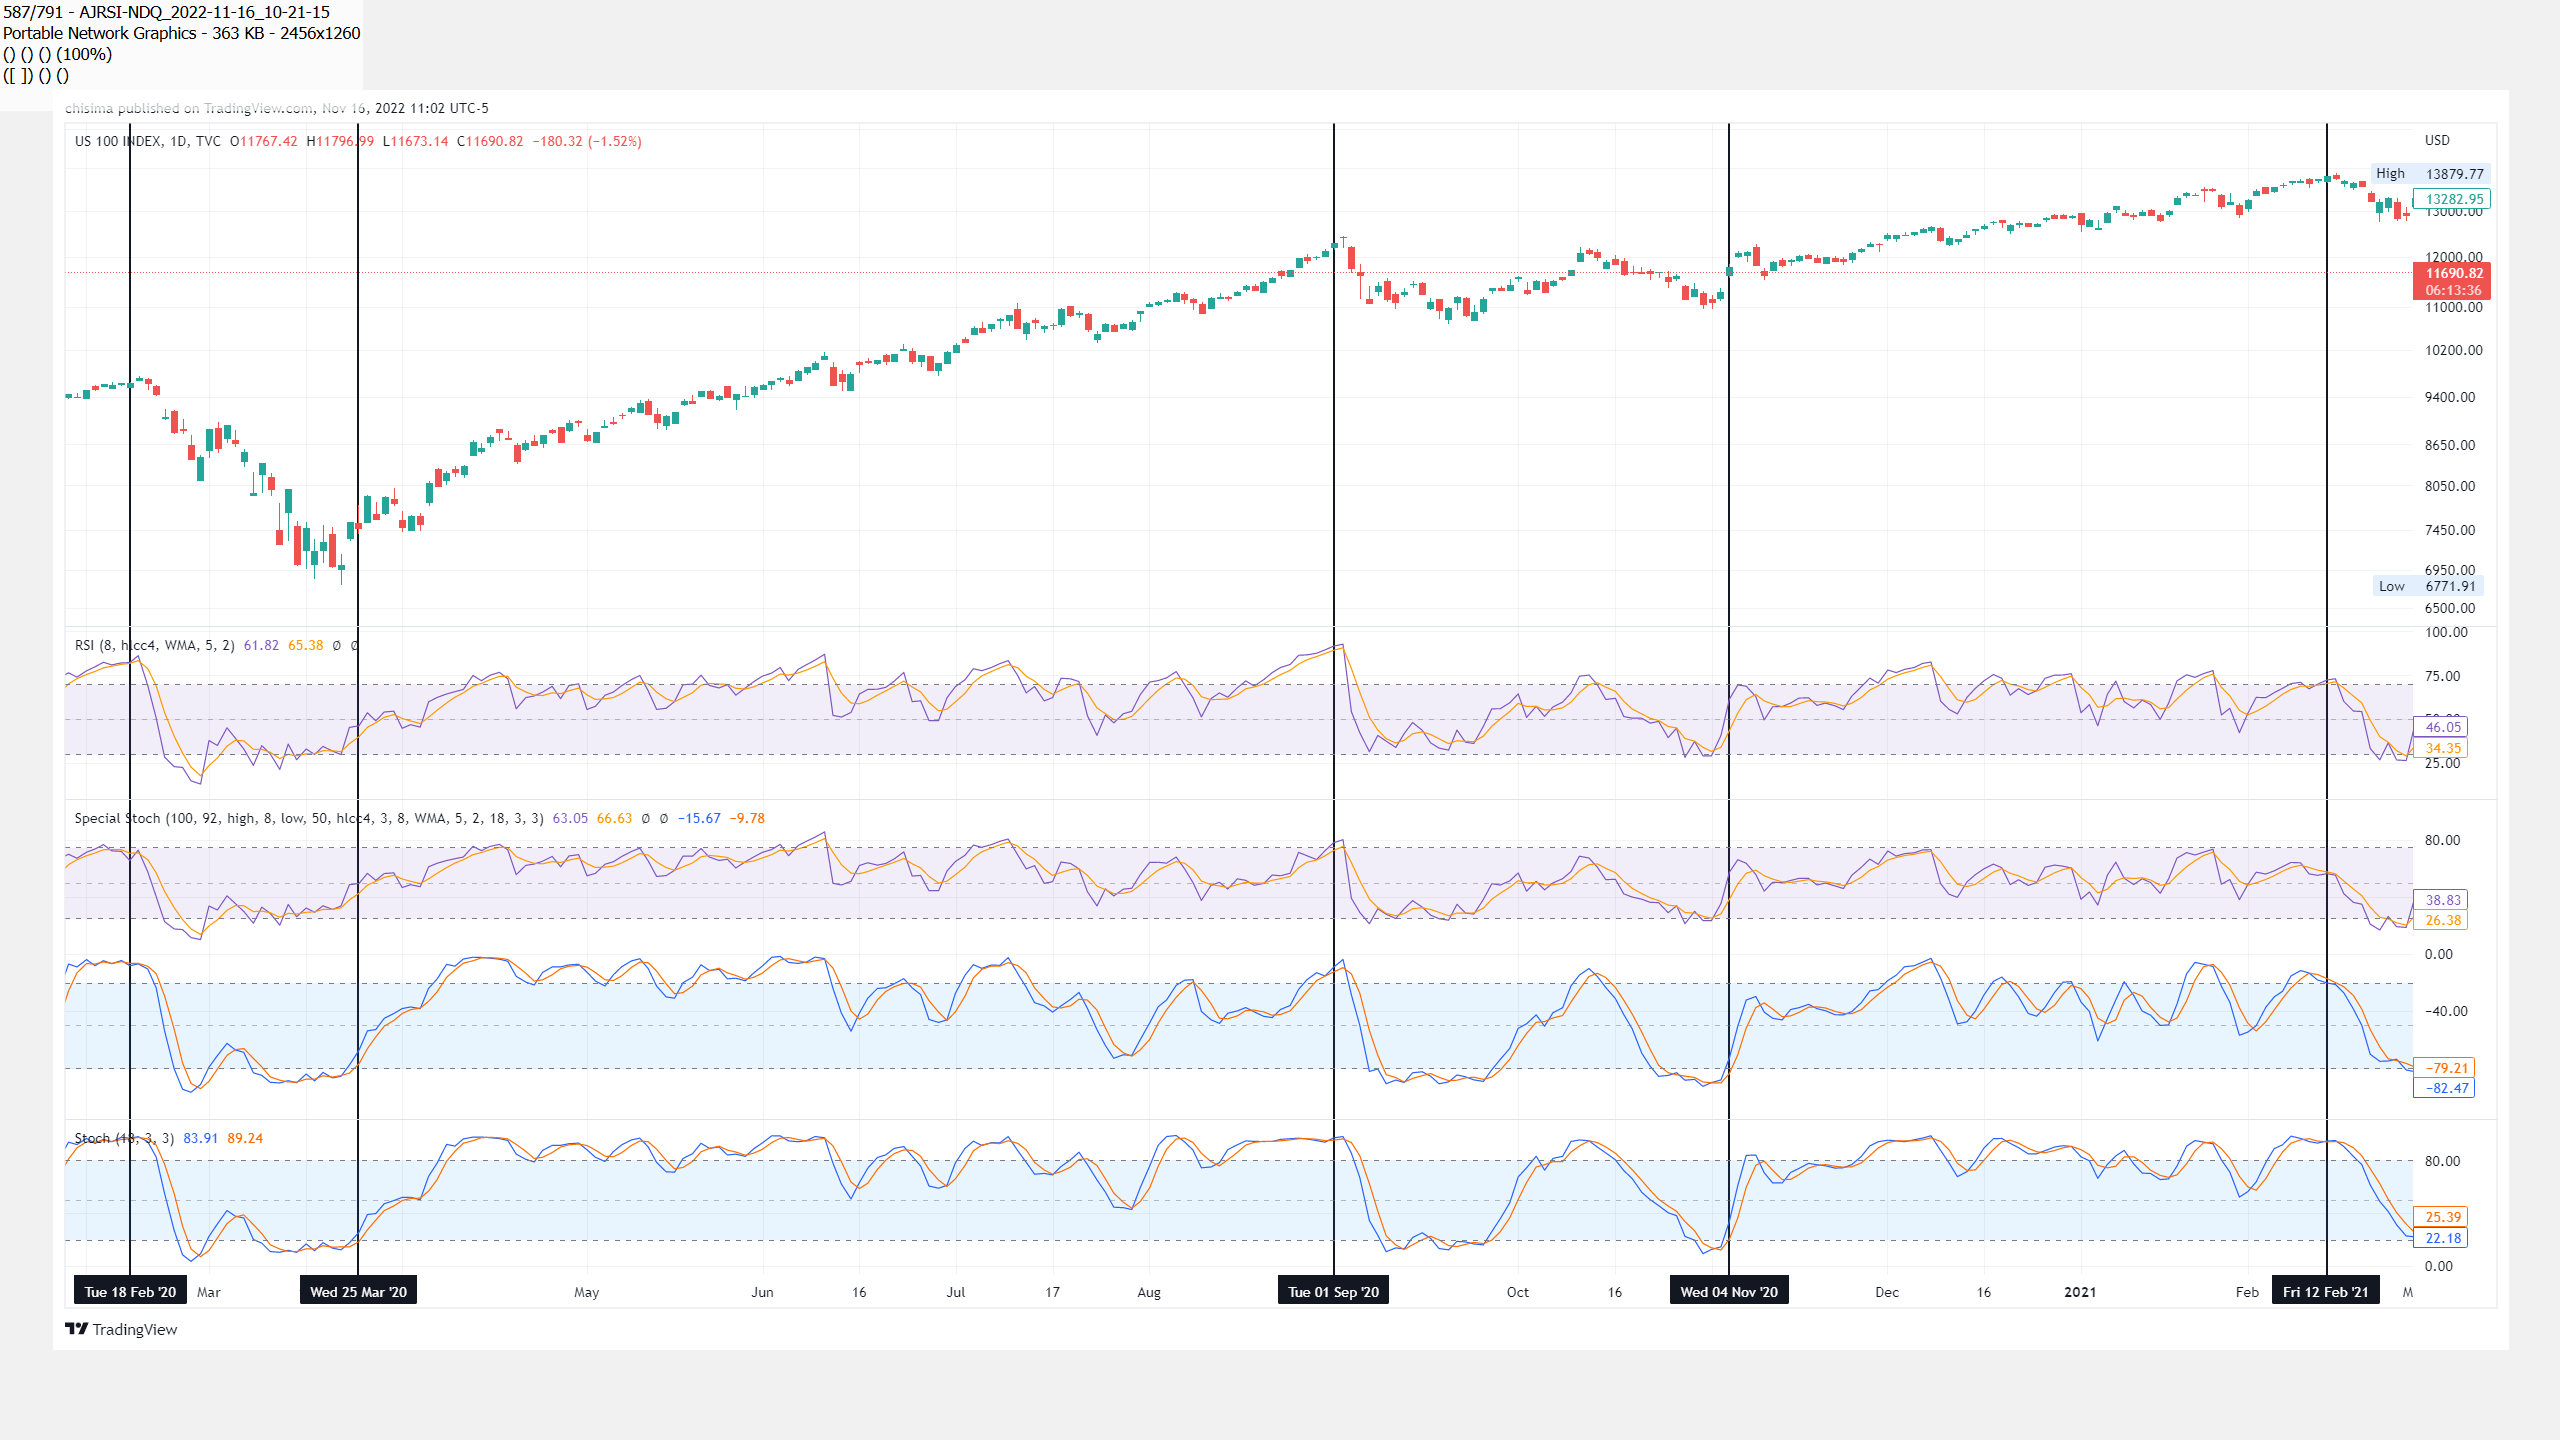
The charts below show NQ (NDX futures) along with the standard RSI (top) and Stoch (bottom). My indicators are the two in the middle. All indicators have exactly the same input parameters, so we are comparing apples to apples.
I am presenting two charts, one covering early 2020 to Nov. The other covering late last year till recently. What I'd like you to pay attention to is this: By and large my indicators and the standard indicators paint the same picture. However, before the market makes big moves, my indicators diverge in a much more pronounced ways than the standard. They will typically show higher low when the market bottoms or lower high when the market is about to make top. They also tend to cross the midline before the standard indicators do.
In summary, I have placed vertical line markers a couple of bars away from major tops and bottoms. I'd like you to pay attention to those general areas where the market made tops and bottoms and compare mine vs the standard indicators. It should be helping you stay one day ahead of the market.
Secondly, compare it during the normal days, and it should be telling you a similar story as the standard tools
Thanks,
ST
Next
 |
|


