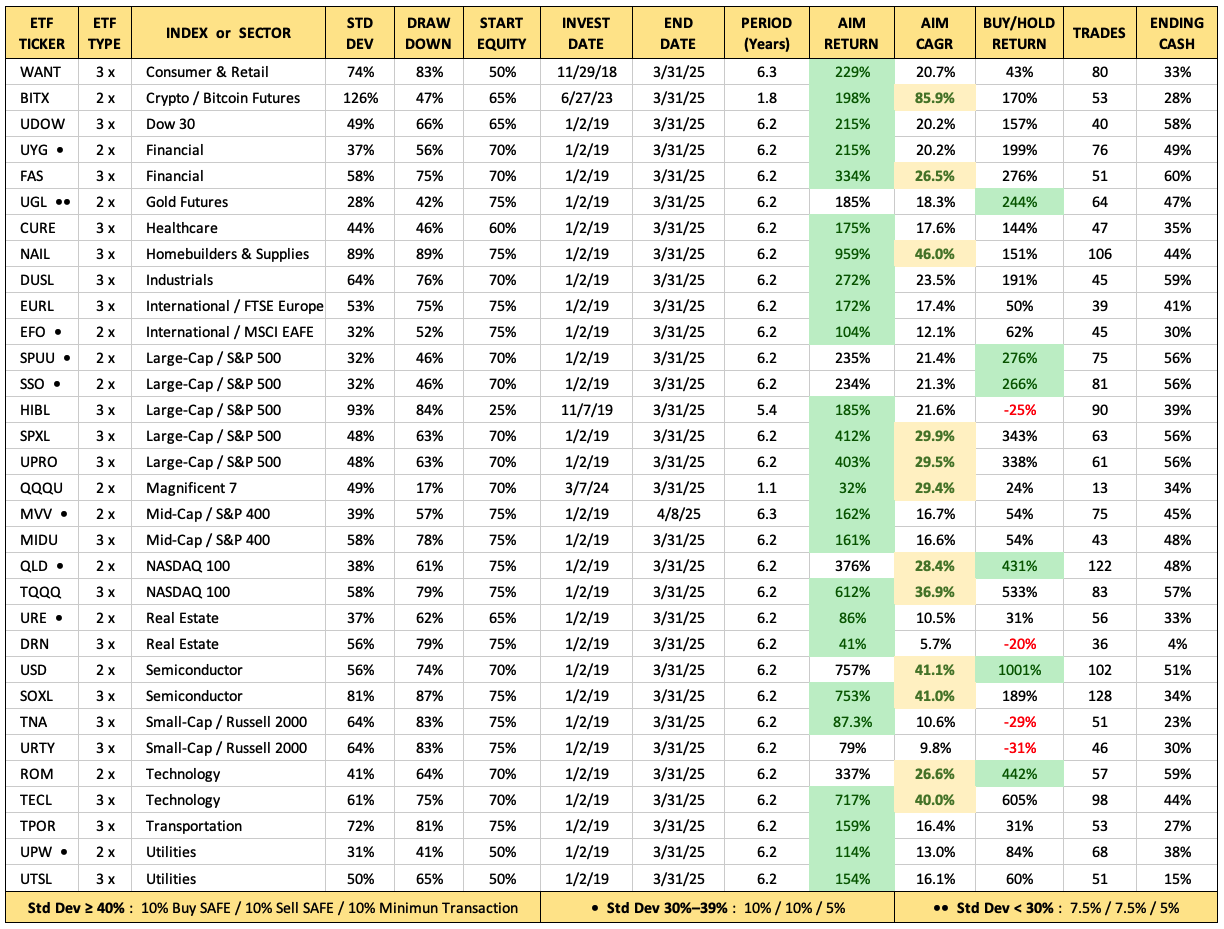
••• Completed AIM backtesting of 32 leveraged ETFs •••
These are the leveraged ETFs I selected across multiple indexes and sectors. Some sectors have been omitted, such as biotech, pharmaceuticals, silver, other cryptocurrency, and energy, because the results both with AIM and buy-and-hold were less than stellar. I won't be using those sectors in my AIM investing. The real estate sector is included, and the AIM results are an improvement, but not earth shattering.
Std Dev and maximum Draw Down were obtained from Portfolio Visualizer. Buy-and-Hold returns (including dividend reinvestments) obtained from Stoculator. Historical prices obtained from Nasdaq. Dividend info obtained from each ETF company website.
Methodologies used in backtesting:
- Preemptive AIM model used where limit orders are set for next buy and sell price
- Maximum of one trade per day–this assumes all trades placed outside market hours.
- Std Dev is a measure of fund volatility. AIM settings vary according to ETF volatility, making it easier to capture trades with lower volatility funds.
- Starting Equity based on initial investment share price compared to previous 52-week price range
- For new funds, such as Bitcoin and Magnificent 7, starting equity based on assumption prices would continue higher
- Drawdown curve strategy used to avoid depleting cash before bottom of downtrend was reached
- Black Swan rule was used if cash was depleted
- I used the same strategies in making these decisions and settings I intend to use in actual leveraged ETF investing. Different decisions and settings would obviously generate different results.
- The Above Average AIM CAGR values are highlighted
I intend to update these backtests on some frequency, probably quarterly. I may add a few new funds, and remove funds that underperform or are duplicated by other funds in the index or sector. Let me know if you have specific questions and I'll try to answer.
 |


