A lot of this solar power dreaming comes from calculations like the one below.
Drawbacks such as needed transmission buildout and power losses, needs for massive storage capacity and the associated power losses, capital costs of such super mega projects, cost inflation of labor and materials to build the vast network, NYMBY, security costs, political problems, environmental problems etc., are all ignored.
I imagine the costs of building and installing the solar cells would be a small fraction of the eventual total cost once the politicians, NYMBY local reactionairies and enviro wacks get involved in decision making.
They say they need about 1 million square kilometers of solar cells but with the need for storage and transmission losses and maintenance etc. it will probably be a multiple of that. Imagine building 3 or 4 million square kilometers of solar cells in deserts around the world. Give Al Qaeda lots of big targets.
ez2c.de
Sunlight hitting the dark discs could power the whole world:
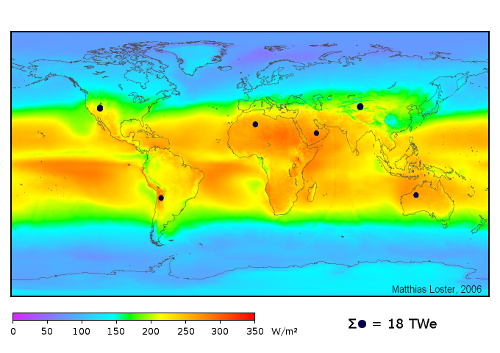
If installed in areas marked by the six discs in the map, solar cells with a conversion efficiency of only 8 % would produce, on average, 18 TW electrical power. That is more than the total power currently available from all our primary energy sources, including coal, oil, gas, nuclear, and hydro. The colors show a three-year average of solar irradiance, including nights and cloud coverage.
Total primary energy supply
The total primary energy supply (TPES) is the sum of all energy resources world wide, like coal, oil, gas, nuclear, and hydro. These resources are converted into gasoline, natural gas, electricity, and many other energy carriers. In 2007, the TPES was 504 Exajoule (EJ) or, on average throughout the year, 16 Terawatt (TW). The blue line in the graph below shows how the TPES has developed in the last decades.

The International Energy Agency (IEA) estimates that by 2030 the average TPES will be 23 TW based on current policies (red line), or 19 TW if policies currently under consideration will be introduced (green line). [1]
Harvesting sunlight
The energy of sunlight reaching the surface of the earth is more than 5,000 times the TPES. It is available directly as sunlight, as wind due to temperature differences, or as hydropower from rainfall of evaporated water. Several routes exist to directly convert sunlight into useful energy:
•Plants (via photosynthesis) => Biomass (low efficiency, needs water and soil)
•Solar thermal => Heat, Mechanic work (efficient, complex structures)
•Photovoltaics => Electricity (efficient, expensive)
Required land areas
If the TPES was to be generated entirely from sunlight, a certain amount of the earth's surface would be needed for capturing. The size of that area largely depends on the efficiency of the conversion technology. An example with a conversion efficiency of 8 % is shown in the figure at the top of this page: Six discs, each large enough to produce an average power output of 3 TW, are distributed across the world in deserts, areas that have plenty of sunlight and little population. The desert locations, their sizes, the average sunlight intensity, and the required areas are listed in the following table:
Location / Desert        Desert size km2 [2]   Required area km2  Irradiance
W / m2
Africa,    Sahara           9,064,960               144,231        260
Australia, Great Sandy        388,500               141,509        265
China, Takla Makan            271,950               178,571        210
Middle-East, Arabian        2,589,910               138,889        270
South America, Atacama        139,860               136,364        275
U.S.A., Great Basin           492,100               170,455        220
Distributed energy
While this example visualizes required land areas, it is better, in many cases, to generate energy closer to where it is needed. Roof tops of buildings and small solar farms are such places, saving transmission costs and, by interconnection, balancing periods of less sunshine.
Map data
The map at the beginning of this page, showing the spatially resolved solar irradiance, is based on an algorithm developed by Bishop and Rossow, [3] using data made available through the International Satellite Cloud Climatology Project (ISCCP), [4] which provides calibrated data collected by geostationary weather satellites around the world. The solar irradiance shown is a three year average from 1991 to 1993 and provides the total irradiance in a grid with 2.5° spacing in lattitude and longitude.
All data points are plotted in orthogonal lattitude and longitude coordinates. In consequence, distances, areas, and angles are increasingly distorted towards the poles. The coastline overlay was obatined from the National Geophysical Data Center (NGDC). [5]
Further reading
The Wikipedia article about Solar Energy has a thorough discussion of this topic:
wikipedia.org
References
[1] International Energy Agency (IEA). "Key World Energy Statistics 2009." iea.org
[2] Map of World Deserts. mapsofworld.com
[3] J. K. B. Bishop and W. B. Rossow. "Spatial and temporal variability of global surface solar irradiance." J. Geophys. Res. 96, 16839 (1991).
[4] International Satellite Cloud Climatology Project (ISCCP). isccp.giss.nasa.gov
[5] National Geophysical Data Center (NGDC), NOAA Satellite and Information Service, Coastline Extractor. rimmer.ngdc.noaa.gov |


