SI
SI
discoversearch

We've detected that you're using an ad content blocking browser plug-in or feature. Ads provide a critical source of revenue to the continued operation of Silicon Investor.  We ask that you disable ad blocking while on Silicon Investor in the best interests of our community.  If you are not using an ad blocker but are still receiving this message, make sure your browser's tracking protection is set to the 'standard' level.
Strategies & Market Trends : John Pitera's Market Laboratory -- Ignore unavailable to you. Want to Upgrade?


To: Hawkmoon who wrote (18051)3/27/2016 1:19:13 AM
From: John Pitera3 Recommendations

Recommended By
Davy Crockett
Hawkmoon
sixty2nds

  Read Replies (2) | Respond to of 33421
 
There Is No Word To Describe This" - The Energy Forward P/E Multipe Is Now Off The Charts

Submitted by Tyler Durden on 03/25/2016 15:31 -0400

(I making these two chart nice AND BIG so no one misses them!!)


The project forward 12 month Price Earnings Ratio's are higher on every sector except for healthcare which is equal and the telecom sector which is projected to be slightly higher. And, or course, the energy service sector is a moon shot.. right up there with the .com bubble of 1999-2000.


Back in January 2015, when we looked at the utterly disconnected fundamentals of the energy sector, we were stunned to note that the forward 12-month P/E for the Energy sector has risen above 22.4, the first time it had done so since April 8, 2002. On that date, the closing price of the Energy sector was 225.15 and the forward 12-month EPS estimate was $10.05.

Our amazement was contained in the following summary: "using the S&P Energy Sector Index data, the sector's forward multiple is now an absolutely ridiculous, mindblowing 23x."

This was 14 months ago. Where do we stand now?

The snapshot answer comes courtesy of the latest Factset weekly earnings insight, according to which as of this moment, the forward P/E of the Energy sector is no longer "an absolutely ridiculous and mindblowing 23x".... it is, in fact, more than double that at 58.7x, which also happens to be more than four times higher than the 15 year average.

There is no longer a word to describe the lunacy where the forward P/E multiple was literally "off the chart" until the Y-axis was doubled.


Where it gets even more surreal is when looking at the forward energy sector P/E (as defined by Bloomberg) charted over time. Yes, we laughed long and hard.


What is beyond strange is that while forward earnings have imploded in just the past three months, prices of energy companies have actually gone up as the next Factset chart shows! In other words, the market's discounting mechanism is not onlyl broke but is now going in reverse, where the worse the projected earnings, the better for stock prices.


However, this type of disconnect - especially when it is as glaring as this - never lasts.

In that vein, one year ago, when oil had first crashed hard and when the S&P energy sector was trading at 550, we calculated that " Either Oil Soars Back To $88, Or Energy Stocks Have To Tumble By Over 40%" Energy stocks indeed tumbled, and at one point the drop was nearly 40% as predicted, but have since jumped higher on more artificial central bank manipulation of prices.


Unfortunately for those buying, this rebound won't last because while central banks may have goosed asset prices, they have failed to stimulate the price of the one all important commodity, the one which flows through to earnings: oil.

Which leads us to a redo of the simple calculation we did one year ago: what does the current disconnect between the price of oil, energy stock prices and valuations mean? The answer, like last January, is simple: either the long-term PE multiple is now null and void, and the "New Normal" forward PE of not only 20x+, but almost 60x, is "realistic", which of course is ridiculous, or there are two alternatives:

  • Energy sector earnings have to surge by 275%, implying oil prices have to more than triple to $148, for the forward P/E multiple to return to normal, or
  • The Energy sector price has to crash from 461 today to 123 where it would trade down to its historic forward 14x P/E multiple, suggesting a price drop of over 70%!
This is shown visually on the table below:


We'll let the algos decide which option works.

-----------------------------

thanks to Hawk for posting this ......

I think this needs some serious consideration.... We have to see if the US FED is going to go ahead and raise interest rate 2 more times this year ... as they are telling us they will and it will trigger the famous "Three steps and a stumble" rule made famous by the late market expert Edson Gould.

A well known rule on Wall Street that was developed by the late Edson Gould and implies that after three consecutive rate hikes the equity markets are likely to stumble, that is, enter a bear market

financial-dictionary.thefreedictionary.com

This also is along the theme of the very brilliant Dr. Martin Zweig who had the famous Maxim "don't fight the FED"

the FED has not raise rates three times yet and possibly will not Momhamed El-Erian has an excellent missive on why we are in for roller coaster markets.. He has a very constructive missive on the increase and expansion of the range of volatility in risk asset markets that I will see about posting online tomorrow...

Here is the link to it

bloombergview.com

I was at a church service tonight that lasted from 8:30 pm until 10:30... the lightening and thunder appeared on
at the right place for dramatic emphasis twice in the service. ( the church has a long slender sky window that goes along the ascending roofline.

John


To: Hawkmoon who wrote (18051)3/29/2016 9:06:00 AM
From: John Pitera3 Recommendations

Recommended By
Hawkmoon
Riskmgmt
roguedolphin

  Respond to of 33421
 
This real estate market is about to crash

Ron Insana
20 Hours Ago

The tallest residential structure in the Western Hemisphere sits at 432 Park Avenue in New York City. Standing at nearly 1,400 feet, there are 141 apartments for sale in a building where there average selling price is $21 million, ten times the price of an "average" Manhattan apartment!

But here's the thing, despite all the amenities, the views and the allure this building may have, the super rich do not appear to be knocking down any doors to get in.

Only 13 units have closed out of 141, according to The Real Deal. Granted those sales brought in a whopping $170 million to the developers, but it raises questions about whether or not the Manhattan real estate market has "topped out" both literally and figuratively.
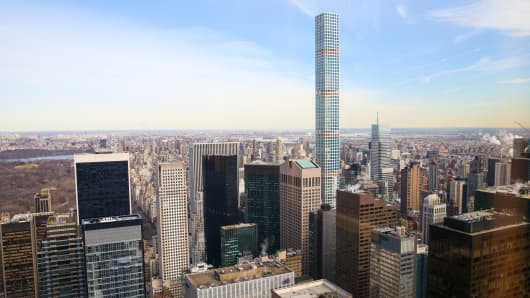

Adam Jeffery | CNBC
423 Park Avenue in New York.

The StreetEasy Blog, which tracks New York real estate markets, notes that expensive apartments are sitting idle for roughly 90 days before being sold, the longest "time on market" since January of 2013.

The late Ed Hart, a credit market analyst with whom I worked at Financial News Network, taught me the very high value of anecdotal information almost three decades ago.For instance, just before the Savings & Loan bubble burst in the 1980s, Ed told me that if you see a lot of antique furniture and art work inside an S&L, short the stock!


To him, it meant that depositor money was being ill used and the institution was bound for insolvency.

On more than one occasion, I witnessed such excesses, only to see the offending lender wind up in receivership a mere few months later

Why this luxury real estate market isn't like most


During the Boston condo glut of the late 1980s, Ed Hart counted cranes.

But I'm not just relying on anecdotes here. In New York today, the Manhattan skyline absolutely filled with construction cranes, something we haven't seen in this town for quite some time.

Real Estate Weekly notes that 70 cranes dotted the Manhattan market in 2015, twice as many as the year before, and almost seven times the number of cranes currently working in Los Angeles. They are mostly devoted to high end condos.

In addition, some 5,377 new high-end condos units are being constructed at a time when DNA Info adds that foreign buyers are either backing away from New York purchases, or buying cheaper residences, thanks to the strength of the dollar, which makes expensive New York apartments that much pricier.

Foreign buyers have accounted for anywhere from 15 percent of total New York City purchases, to as much as 40 percent of Manhattan's high-priced buys in recent years, real estate expert Jonathan Miller told DNA Info.

The U.S. Treasury Department's recent mandate that the identity of foreign buyers be made known, for purchases above $3 million, could be discouraging overseas investors from buying pricey real estate. And that could have a dramatic impact on sales going forward.

432 Park Avenue is only one of as many as a dozen residential and commercial buildings that will compete for the "tallest" moniker in New York in the next several years.


That leads to yet another one of those pesky anecdotes. The erection of a region's tallest building has, since the early 1900s, been associated with both stock and real estate market tops, as well.

The Woolworth building in 1907; the groundbreaking on the Chrysler and Empire State buildings in the late 1920s; the World Trade Center in the early 1970s, along with the Sears Tower in Chicago; the Petronas Towers in Malaysia in 1997, the Burj Khalifa in Dubai in recent years, and the Shanghai World Financial Center in 1998, all correlated closely with stock and real estate market peaks.

Despite the rosy view of builders, there is a serious risk, in my view, that the supply of (mostly) expensive new housing in New York may outstrip demand for some years to come.

Add to that a potential glut of commercial real estate as well. Never in my career have I heard of capitalization rates falling below three percent, even in Manhattan. "Cap Rates" are a way of valuing commercial real estate. The lower the cap rate, the richer the valuation.

One prominent hotel operator recently confided to me that some 20,000 hotel rooms are being added in New York City, just as occupancy rates are beginning to edge lower, reinforcing the notion that the "tourist trade" in real estate may well be coming to an end.

It's ironic that New York City largely escaped the property bust that engulfed the world in 2008, despite being the very epicenter of the mortgage credit crisis

For Manhattan, the after-shock of a national real estate crash may be worse than the earthquake that rocked the nation itself.

If you see steep discounts at the city's tallest buildings anytime soon, you may still not be able to afford a multi-million dollar apartment, but you can make money shorting those entities most exposed to an edifice that is likely about to get wrecked.

Commentary by Ron Insana, a CNBC and MSNBC contributor and the author of four books on Wall Street.

cnbc.com