Weighing The Week Ahead: Can Resurgent Earnings Revive The Stock Rally?
Apr. 9, 2017 4:36 AM ET
Summary
Last week was eventful, but with little market effect.
The economic news was solid, but the political and geopolitical issues increased.
Earnings season begins in a short market week.
Expectations are for strength -- perhaps great strength.
What might an earnings surge mean for your stocks?
Are you ready for some real news? How about corporate earnings? While there is some economic data on tap, the Q1 earnings season starts in earnest this week. With questions about economic strength, the dollar and the Fed in mind, pundits will be looking for fresh data. They will be asking:
Can resurgent corporate earnings revive the stock rally?
Last Week
Last week the news was heavy but generally neutral. Strong economic data caused celebration. The Fed minutes and concerns about tax reform were the biggest negatives.
Theme Recap
In my last WTWA I predicted special attention to the Trump-Xi meeting. That was a good call, with plenty of discussion all week. The talks did not yield much news, but there might be a lesson from that as well.
The Story in One Chart
I always start my personal review by looking at a weekly chart. While there was not much of an overall change this week, Wednesday was the exception. Stocks moved sharply higher after the ADP number and sold off sharply in the afternoon, perhaps because of reaction to the Fed minutes, perhaps because of tax reform prospects. 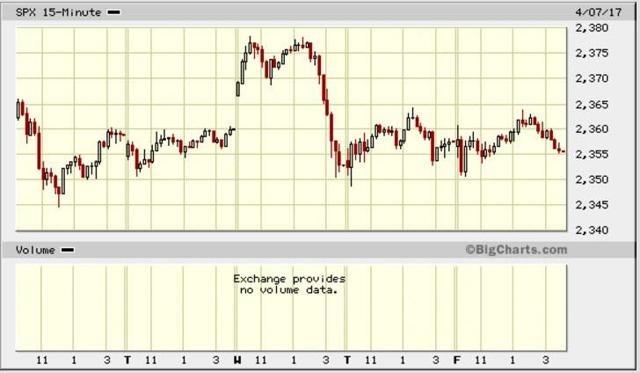
The News
Each week I break down events into good and bad. Often there is an "ugly" and on rare occasion something very positive. My working definition of "good" has two components. The news must be market friendly and better than expectations. I avoid using my personal preferences in evaluating news – and you should, too! This week's news was neutral.
The Good
Construction spending rose 0.8%. Steven Hansen ( GEI) is not convinced.Rail traffic in March increased 7.3% ( AAR).ISM manufacturing maintained recent strength at 57.2. Scott Grannis offers this chart.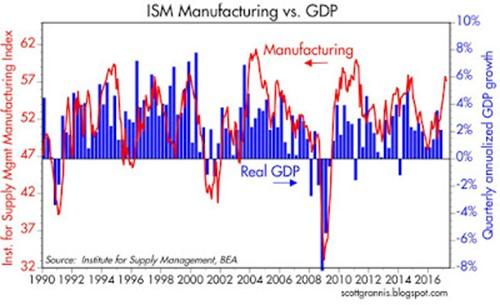
ADP private employment registered a change of 263K, handily beating expectations.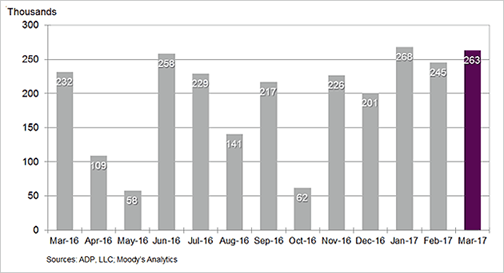
Weekly jobless claims dropped to 234KThe Bad
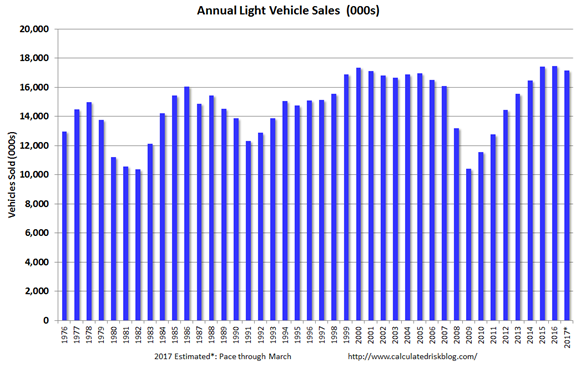
Tax reform prospects seemed to get worse – at least that was the market take on Speaker Ryan's press conference.The Fed may be reducing its balance sheet. ( Reuters). Fed expert Tim Duy thinks that balance sheet reduction will be gradual.Auto sales were surprisingly weak. Calculated Risk concludes:
This isn't a huge concern - most likely vehicle sales will move sideways at near record levels. But the economic boost from increasing auto sales is probably over.
ISM services dropped to 55.2. This is still a strong level, of course, but any dip from a peak is drawing attention.Non-farm payrolls registered a net increase of 98K, well below expectations. Doug Short has a nice chart pack, including this rolling average interpretation of non-farm payrolls.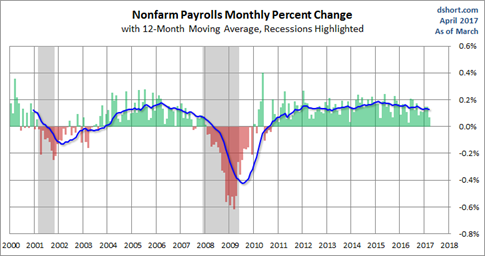
The Ugly
Rising global threats including Syrian gas attacks, North Korean challenges, and more terrorist attacks.
The Silver Bullet
I occasionally give the Silver Bullet award to someone who takes up an unpopular or thankless cause, doing the real work to demonstrate the facts. No award this week, but nominations are always welcome. There are many bogus claims and charts out there!
The Week Ahead
We would all like to know the direction of the market in advance. Good luck with that! Second best is planning what to look for and how to react. That is the purpose of considering possible themes for the week ahead. You can make your own predictions in the comments.
The Calendar
We have a normal week for economic data, including releases on Friday when financial markets are closed.
The "A" List
Michigan Sentiment (T). Continued high readings and debate over "soft" data.Retail sales (F). Will negative consumer news be confirmed?Initial jobless claims (Th). Is the series edging up from record low levels?The "B" List
JOLTS (T). February data. This is about labor market structure, not job growth!PPI (Th). Still tame, with more of the same expected.CPI (F). See PPI. The core increase is starting to approach the Fed's target level.Business inventories (F). Not much expected from this February data.Crude inventories (W). Recently showing even more impact on oil prices. Rightly or wrongly, that spills over to stocks.
The schedule is light on FedSpeak and many markets around the world are closed on Friday.
Next Week's Theme
In a normal week for economic data the start of the Q1 earnings season will command attention. Geopolitics will grab some headlines, but market participants are eager to see if the recent stock market strength is supported by corporate earnings. The key question?
Will resurgent earnings revive the rally in stocks?
Each earnings season sees a revival of a familiar theme: Companies guide expectations lower. The final report is a "beat" compared to this lowered bar.
More objectively, observers can compare earnings to the prior year. The weak energy sector has been a drag on these comparisons, leading to an "earnings recession." This name was attached to two consecutive quarters of decline. This quarter seems more promising. Earnings expert Brian Gilmartin does a sector-by-sector analysis, concluding that this quarter might see S&P 500 growth of 12-14%.
John Butters of FactSet notes that current expectations are an increase of 8.9%, but that "double-digit" growth is more likely. He looks at the history of "beat rates."
What does this all mean for investors? As usual, I'll have a few ideas of my own in today's "Final Thought".
Quant Corner
We follow some regular featured sources and the best other quant news from the week.
Risk Analysis
Whether you are a trader or an investor, you need to understand risk. Think first about your risk. Only then should you consider possible rewards. I monitor many quantitative reports and highlight the best methods in this weekly update.
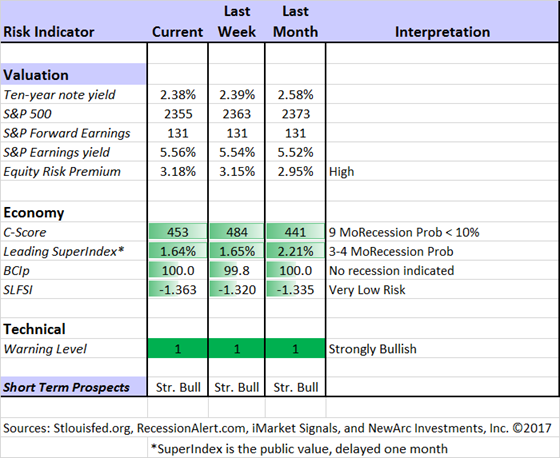
The Indicator Snapshot
The Featured Sources:
Bob Dieli: The "C Score" which is a weekly estimate of his Enhanced Aggregate Spread (the most accurate real-time recession forecasting method over the last few decades). His subscribers get Monthly reports including both an economic overview of the economy and employment. (see below).
Holmes: Our cautious and clever watchdog, who sniffs out opportunity like a great detective, but emphasizes guarding assets.
RecessionAlert: Many strong quantitative indicators for both economic and market analysis. While we feature his recession analysis, Dwaine also has several interesting approaches to asset allocation. Try out his new public Twitter Feed.
Georg Vrba: The Business Cycle Indicator and much more. Check out his site for an array of interesting methods. Georg regularly analyzes Bob Dieli's enhanced aggregate spread, considering when it might first give a recession signal. His interpretation suggests the probability creeping higher, but still after nine months.
Brian Gilmartin: Analysis of expected earnings for the overall market as well as coverage of many individual companies. His most recent post notes that the expected growth rate in S&P earnings is now 8.41% -- the highest level since October, 2014.
Doug Short: The World Markets Weekend Update (and much more). His Big Four chart is the single best method to monitor the key indicators used by the National Bureau of Economic Research in recession dating. The latest update now includes the employment data.
How to Use WTWA (especially important for new readers)
In this series, I share my preparation for the coming week. I write each post as if I were speaking directly to one of my clients. Most readers can just "listen in." If you are unhappy with your current investment approach, we will be happy to talk with you. I start with a specific assessment of your personal situation. There is no rush. Each client is different, so I have eight different programs ranging from very conservative bond ladders to very aggressive trading programs. A key question:
Are you preserving wealth, or like most of us, do you need to create more wealth?
Most of my readers are not clients. While I write as if I were speaking personally to one of them, my objective is to help everyone. I provide several free resources. Just write to info at newarc dot com for our current report package. We never share your email address with others, and send only what you seek. (Like you, we hate spam!)
Best Advice for the Week Ahead
The right move often depends on your time horizon. Are you a trader or an investor?
Insight for Traders
We consider both our models and the top sources we follow.
Felix, Holmes, and Friends
We continue with a strongly bullish market forecast. All our models are now fully invested. The group meets weekly for a discussion they call the " Stock Exchange." In each post I include a trading theme, ideas from each of our five technical experts, and some rebuttal from a fundamental analyst (usually me, but sometimes a guest expert). We try to have fun, but there are always fresh ideas. Last week the group discussed how to find trading ideas in a quiet market. We were delighted to have expert commentary from Chuck Carnevale, founder of F.A.S.T. Graphs and a frequent source for WTWA. Check out the five stock ideas from our regular group, and especially Chuck's reactions.
Top Trading Advice
Brett Steenbarger continues his stream of great posts. My favorite this week is his explanation of the real reason traders lose money. That should certainly attract universal interest! Here is a key takeaway:
There is only one source of making money in markets, and that is identifying recurring patterns in market behavior and exploiting those in a manner that provides solid reward relative to risk. We marshal and attenuate various personality traits to identify and exploit those patterns. Success comes, not from indulging our personalities, but from knowing which traits to draw upon and which to work around. That is called wisdom.
Peter Coy has great advice for system traders: Beware of excessive back fitting of your data. If this seems too nerdy, you are probably making serious errors in developing your trading system.
Insight for Investors
Investors have a longer time horizon. The best moves frequently involve taking advantage of trading volatility!
Best of the Week
If I had to pick a single most important source for investors to read this week it would be Gary Belsky's, Why We Think We're Better Investors Than We Are.Here is a sample, comparing an unhappy lawyer with a disappointed investor:
Both people are highly likely to obsess over their sunk cost — law school tuition and time served for the lawyer, the original investment amount for the stock picker — in a nonconscious desire to justify their earlier decisions. Both are also very likely to fall prey to "loss aversion," a key tenet of Prospect Theory, which tells us that humans typically respond to the loss of resources — be it time, effort, emotion, material goods or their proxy, i.e., money — more strongly than they react to a similar gain.
What differentiates the typical lawyer and average investor, however, is their justification for engaging in their activity. Lawyers are trained to do what they do, while the majority of investors are not. Ask a random player in a law firm's basketball league whether he or she could compete with LeBron James, and the most common response will be laughter. Yet many of those lawyers would willingly compete with the billionaire investor Warren E. Buffett.
Stock Ideas
Barron's has some undervalued energy stocks for consideration.
Our Stock Exchange always has some fresh ideas. There are ideas from five different approaches. Felix, who is most aligned with long-term traders, likes Sprint ( S). You will enjoy the careful response of our guest expert, Chuck Carnevale, to that idea! The entire post has a good discussion.
Blue Harbinger has ten attractive ideas with 10% yields. It is a thorough analysis, and read the cautions carefully.
Personal Finance
Professional investors and traders have been making Abnormal Returns a daily stop for over ten years. If you are a serious investor managing your own account, this is a must-read. Even the more casual long-term investor should make time for a weekly trip on Wednesday. Tadas always has first-rate links for investors in his weekly special edition. As usual, investors will find value in several of them, but my favorite is Jane Hwangbo's 6 Things You Don't Know About Money. The six points are interesting, as is this conclusion:
The point of money is to magnify you.
If you care about something, you get the opportunity to make more impact. If you love someone, you can give them more of what they need. You can share more. You can contribute more. You can invest in your future more.
You get more options.
In his regular column, Seeking Alpha Editor Gil Weinreich takes up an intriguing question – whether boomer retirements will cause a market crash. There is also a good discussion as well as links to other sources.
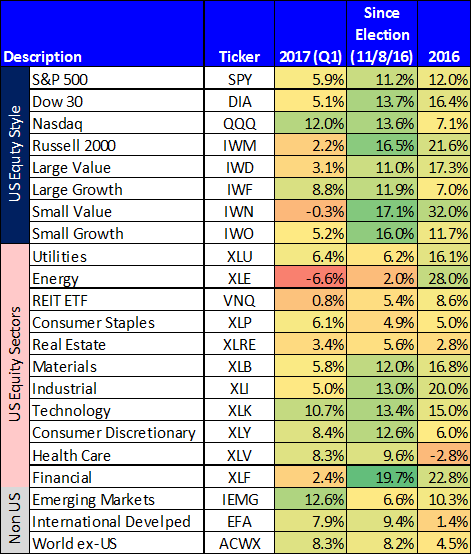
Value versus Growth
It is always interesting to see whether market sentiment is favoring value or growth. Blue Harbinger provides this interesting table.
Watch out for…
Kinder Morgan ( KMI) and other pipelines. The operations are amazingly extensive.

The "toll road" analogy is also seductive for the pipeline companies. But that is only part of the story. Simply Safe Dividends has an excellent and thorough examination of the underlying finances, cost of capital, safety of the dividend, and the effect of changing energy prices.
Final Thoughts
There are several developing themes that require more elaboration than I can provide in WTWA. In such cases I often state my conclusions in advance – with more to come. Here are a few such ideas.
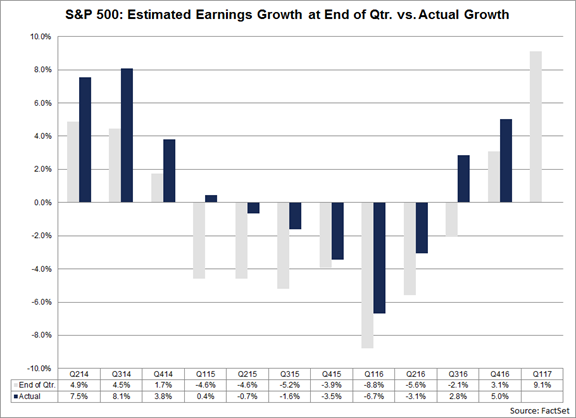
There are some lessons from the Trump-Xi meeting. Nothing bad happened. That may not seem newsworthy, but it is useful intelligence.President Trump had his first test as Commander-in-Chief. He consulted experts and took their advice. Whether or not you agree with the decision, the process is better than we might have expected a few weeks ago.The hard data, soft data meme is the latest way to find a source of market worry. The definition of the categories is not objective, nor is the analysis of the sources carefully done. This is definitely an agenda item.The employment report is a single important example. The headline payroll report change was only about 100K. Despite repeated warnings that sampling error alone is +/- over 100K jobs, discussing smaller changes is great sport. The ADP report is a good independent source. Jobless claims are excellent. Wages are rising. The unemployment rate is declining. There is no reason to look for excuses (like the weather) for a weak number. But pundits must earn their pay!Each earnings season I offer a challenge. I am still waiting for an answer. Those who do not trust earnings say that the estimates are too optimistic. They also say that (at the time of the report) they are too low. If both are true, there must be some point in time when the estimates are pretty accurate. John Butters provides this interesting table, looking only at the last-quarter effect.
If earnings growth continues this pattern it can do the following:
Increase confidence in earnings estimates;Increase confidence in an improving economy;Provide the basis higher forward earnings;Support the idea of a higher PE multiple.Eventually, whatever the other worries, it is all about earnings.
seekingalpha.com |


