every 20 -23 years or so the tech stocks get immersed in this massive "new era" euphoria..... and
it's always a spectacle to behold..... and like a the 17th hole on Augusta when the grass has dried out.....
the balls grow legs....... and manage to go a go bit further than the way the hole played in the morning...
when the dew was on the grass....
------------------------------------------------------------
looking at the Monthly NASD comp chart compared to November..... very little in this chart has changed.
This is looking very much closer to a top when you look at interest rates, the action in the currency markets
the action in the SPX ..... but we shall let the market tell the tale.

Message 31375533
---------------------------------------
| To: humble1 who wrote (20537) | 12/2/2017 2:40:56 AM | | From: John P | 1 Recommendation Read Replies (1) of 20927 | | Tudor to Shutter Discretionary Macro Fund in Restructuring
By Hema Parmar
November 30, 2017, 10:52 PM EST Updated on December 1, 2017, 8:55 AM EST
Flagship Tudor BVI fund will be the only multi-trader fund
Paul Tudor Jones says macro trading on verge of big change

Paul Tudor Jones is shaking up his hedge fund, which has been battered by investor withdrawals.
Tudor Investment Corp. is closing its Discretionary Macro fund and letting investors shift assets to the main BVI fund as of Jan. 1, according to an investor letter seen by Bloomberg News. Jones will also principally manage Tudor’s flagship BVI fund, which will be the firm’s only multi-trader fund next year, the Nov. 30 letter said.
Andrew Bound and Aadarsh Malde, who were co-chief investment officers of the Tudor Discretionary Macro Fund, will be leaving by mutual agreement, the letter said. The fund, which lost 1.6 percent this year through Nov. 3, is made up of multiple managers not including Jones himself. Jones, who ran the BVI fund with a team of managers, will now have a smaller team and will assume a more dominant role in the fund.
"I will be the largest risk taker and will manage a notional capital account equal to the AUM of the Tudor BVI strategy itself," Jones said in the letter, referencing assets under management. "This means that my results will have a one-for-one performance impact on Tudor BVI. I relish this challenge."
Jones and other Tudor partners are the largest investors in the BVI fund, which is up 0.8 percent this year through Nov. 3, a separate investor document showed.
A spokesman for the firm declined to comment.
‘Dangerous Place’
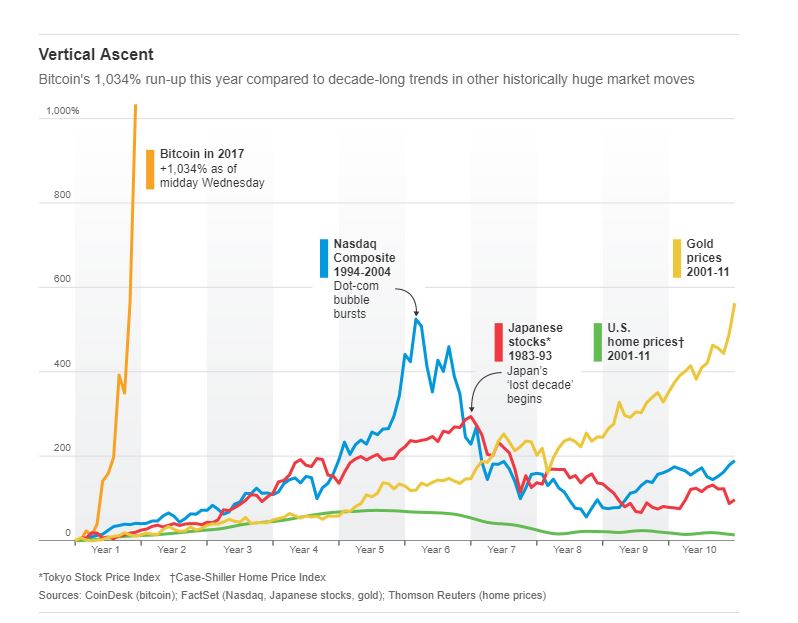
Years of central bank monetary easing has suppressed market volatility, hurting macro fund returns and spurring investor withdrawals. Clients pulled a net $500 million from Tudor in the third quarter, leaving the firm’s assets at $7 billion, about half the level it managed in June 2015, Bloomberg News reported in October. Jones, who has been frustrated with the macro trading environment, said things are "on the verge of a significant change" and that the current market is reminiscent of the bubble of 1999.
"That was a year in which Tudor BVI’s macro book was basically flat while U.S. equities experienced one of the greatest bubbles in history,” Jones, 63, wrote. “The termination of that bull market kicked off a three-year macro feast.” That storyline is much the same today, with bitcoin and fine art taking the place of the Nasdaq 100 of 1999, he wrote.
The low volatility market environment has been an "anathema" to traditional macro funds and is becoming a "dangerous place," lulling investors into a false sense of complacency, Jones wrote in a separate Nov. 30 market note.
"In the face of a shock, investors may be surprised to find themselves jammed running for the exit," he wrote. The amount and quality of liquidity is lower than people recognize, and hidden leverage in the market will make a mass exit even more challenging, he said.
The firm opened the Tudor Discretionary Macro Fund in 2012 with $500 million. It had 14 portfolio managers and was seeded with $150 million from the firm. At the time, funds that bet on macroeconomic themes were a big draw for investors who expected the strategy to benefit from events such as the European sovereign debt crisis.
Those expectations were dashed as the strategy has produced lackluster returns in recent years. Hedge funds betting on macroeconomic themes climbed an average of 3.8 percent this year through October on an asset-weighted basis, to rank as the worststrategy globally, according to Hedge Fund Research Inc.
Billionaire Jones, a pioneer in the industry, has turned to more computer-driven trading and hired scientists and mathematicians to help revamp the firm. Tudor raised about $300 million for a new macro fund, which started trading in October, that uses machine-learning algorithms to help its manager make trades.
— With assistance by Katherine Burton
bloomberg.com
-------------------------------------------------------------------------
just for grins..... we present the Nasdaq composite 25 year monthly chart... seeing as we closed the
book on November on Thursday's close.
I am leaving the Fibonacci, time cycles and Gann work off as the charts get way to complicated.....
this is a KISS chart.... (Keep it simple stupid)
Right now it's pretty darn hard to find a chink in the fine bone English Wedgwood china..
looking at this chart and yet the concerns that Paul Tudor Jones raises are legitimate as well...
with the knowledge that the stockmarket is the last place to look for tomorrows news....
lets see what the bulls see.....
1)The chart has new highs in the Accum/Distribution index, is above the MA and is accelerating higher
2) The Money Flow index is at a 25 year high and is not showing distribution
3) The Welles Wilder RSI -- with the C Brown MA cross over system is on a buy
4) more significantly the RSI has made a NEW high exceeding the Momentum high in December of
2013,,,, the market statistically just about never makes a major high with out a momentum divergence!
in the 1990's you can see that the highest reading in the data series was May of 1996, I believe
that may have been when Dr. A Greenspan began contemplating "irrational exuberance" and we can
see that the NASD had a high of 1254.32 at that point and was able to go parabolically above the
Bollinger band Making a high of 85.38 on the RSI index on for the Dec 1 1999 reading and then
finally did make a divergence with the March 2000 blow off top. In fact at that point it was a double
momentum divergence with the previous November and the high RSI point @ 88.26 for the 5/1996
reading
5) The 200 period MA on Volume is fine not to high or too low... just right it can be advocated.
6) The Chaikin Money Flow index has expanded and made a New HIGH for the entire bull cycle move
since the Liquidation dotcom, B2B and tech bubble of march 2000.
Even the Global Great Financial Crisis was not as savage on the NASD Composite and technology
stocks as they was still residual buyers remorse from the .com mania.
I will be very honest in saying that viewing this chart is much more bullish than I would have thought.
Now the central theme of the GFA story is that it is the currency markets and interest rate differentials that
calibrate create the flow of funds in ALL asset classes... So looking at equity charts is never going to tell. one the Big picture global macro flow of funds situation.

There will be an awful lot of very interest Monthly chart to examine over the next week or so.... I have seen
around 323 and we are in really amazing times.....
The CME announced yesterday that they will be launching Bitcoin futures... Now the date is pushed back
from Monday Dec 11th until Dec 18th.... that is going to be interesting and exciting.... Lets see what
the CFTC and the CME can do.... the CME certainly does have the expertise in managing counterparty
risk and there are presumably some people who are inherently long Bitcoin and they can create covered
call strategies... the whole vast ocean of Option strategies.... that would presumably shortly follow an exchange traded futures contract.
There are a really massive number of 1906 bucket shops making markets in Bitcoin, bitcoin futures,
the several forks of bitcoin and the other cryptocurrencies....
I can state fairly emphatically, that there are very, very few people who really know exactly how this is
all going to play out.
If the CME does get a Bitcoin Futures contract going....
It also would presumably bring in Institutional money and the key Global banking and derivatives players
who really need new virgin forests to harvest valuable timber (in this case the wide bid ask margins and
market inefficiency of new markets.)
We also have a geek world that is highly interested in Blockchain transfer and transaction technology,
cryptocurrencies and Bitcoin in particular..... The men and women on main street are in a buying mood,
and the Global Central banking balance sheets are growing every day.... especially the BOJ, ECB and a
few others since they have so many assets on the books that have been appreciating very nicely.
16 to 17 Trillion dollars of Global Quantitative easing has been earning a return on the assets on those
balance sheets. The number has got to be up into the 23 to 26.8 Trillion range on a Mark to market basis.
Few people are able to aggregate and run Global Liquidity aggregate numbers on a live time basis, and
thus this does add an element of "je ne said quoi" mysticism to the Grand experiment with ZIRP, QE,
Negative Sovereign interest rates... you now it's almost 2018.....
and we are in this profound new environment of a synchronized global increase in Central bank interest
rates; coupled with a current ocean of liquidity.... 1300 cryptocurrencies...and how many ICO's??
and we also have Machine learning, Deep Learning,, Autonomous Driving.... and A.I. going for us,
which is nice as Joe Kernan riffing on Bill Murray in "Caddyshack" often intones on must see fiber...
Squawk Box.. live from Squawk Square..... A R Sorkin is still agnostic on renaming Times square to
Comcast square... due to his work for the NYT (understandably so... Fenway Park is still Fenway Park)
... A R S is a very accomplished man.... Becky Quick has the "in the moment" interpersonal
skills, acumen ... and she has seamlessly transitions from comedy back to "serious news" - Kudos
but I digress..
so as we wind on down the road to the Singularity; we have much to contemplate and oh so much to
see and do....... as Theodor Seuss Geisel wrote in one of his last books "oh the places you will go"
and so shall we. Barton Biggs of Morgan Stanley knew we were in an exuberant period in 1997 and
1998-99.... It will be interesting to get a 5 or 7% shake out in US Equity indicies
to see what that looks like these days... stay tuned.
buy a few negative coupon 10 year Swiss sovereign bonds.... you will be happy to have them....
The Art of asset class diversification is still with us...
Theodor Seuss Geisel was a German-American author, political cartoonist, poet, animator, book publisher, and artist, best known for authoring more than 60 children's books under the pen name Dr.Seuss (/sju?s/). His work includes several of the most popular children's books of all time, selling over 600 million copies and .
I will see about expanding on these themes and bring in more of the material that has been presented
by myself, the other SI old hands as well as all the insights that come from 'my network'
maybe it's just simply just the "network" like the seminal must see 1976 movie.... learn from the great works
or literature, motion pictures, music... all of the arts... Artists see things that us mere mortals do not... ;-)
JP |
| |
-----------------------------------------
Message 31245651
| To: robert b furman who wrote (19832) | 9/1/2017 4:57:47 AM | | From: John P | 1 Recommendation of 20927 | | A few charts..
lets start off with the 20 year monthly NASD Compq chart which is done in equivolume bars..... 1st of all we decisively took out the 5132 high which was the High water mark for the NASD bubble back in March of 2000...that was taken out to the upside in the second half of 2016... quite bullish in the long term.
2) The month price bars have managed to get a bit outside and above the upper bollinger band, this is bullish as it shows upside momentum and markets typical go on to make a higher high when they are above the BB... if they are topping the will go no where near going above the higher BB.
3)We have had pretty stable volume on the advance the past 6 to 8 months.
4) The Month RSI Moving average cross over system is telling us 2 bullish things first the RSI has hit a higher high than the momentum high of 3 to 4 months ago... that is indicating accelerating momentum and
at a minimum you would expect to see a higher high in price going forward, with a lower high on the RSI, THUS creating a potential momentum sell divergence.... that is presently not the case...... -- so this is bullish.
5) the RSI moving average crossover system is on a solid buy. --- bullish
6) the Full stochastic is suggesting the opportunity for a price pull back of some nature... but it is not predictive
of the magnitude and has over all been a generating bullish looking market.
Now remember this is a monthly chart and so you can get a 10/12% correction or even a 17% correction while keeping the larger bull scenario on track.

The daily 1 year Nasd
one the 1 year comp...the NASD has done a nice job of generally holding the 50 dma and has now been vaulting up northward... new highs distinctly possible
we have had a nice move up in the full stochastic and it shows no sign of rolling over as of yet....more upside.. Again the springy price actions the last 3 days is nicely bullish.
The Money flow index is improving and the Chaikin after giving us little scare by tinkering with going negative is back in positive territory and is improving at the moment..
Prices today slightly exceeded the upper bollinger band .... very bullish especially if we see a bigger break above the upper BB tomorrow or next week.

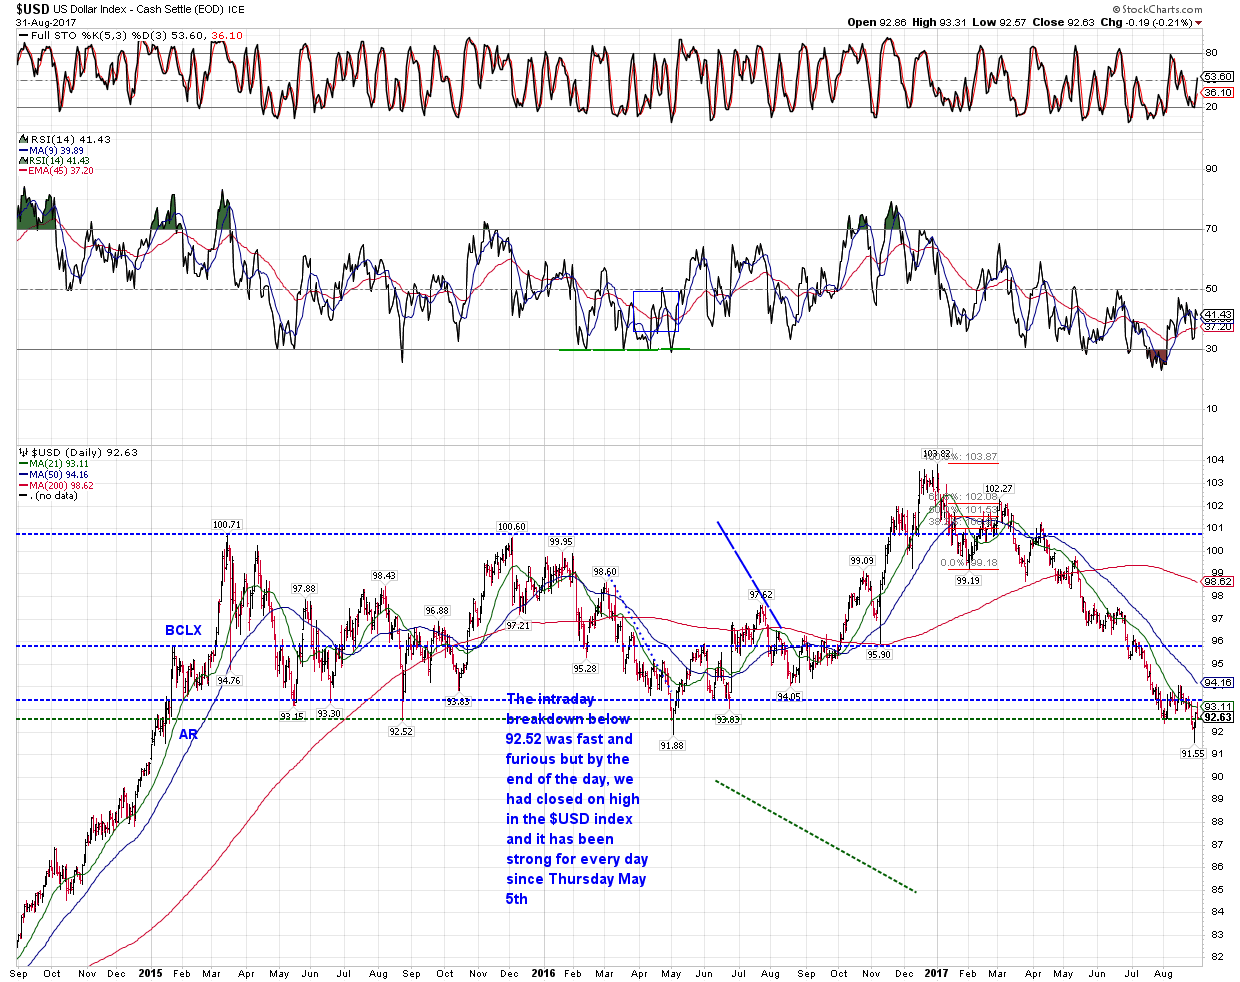
A 3 year chart of the USD, for all of the fear and consternation regarding an excessively weak USD.... you can see that we are at the bottom of the range of the 3 year Wykoff box and This protracted sell off has gotten people bearish on the buck more due to the length of time of the correction.. and yet we have held the line in sand that has provided a few bearish fake outs of the past 3 years....
a Plus to the cheaper dollar is that overseas corporate earnings will carry a bigger bang for the buck due to the increasing competitiveness of US products and services when the dollar get towards the relatively undervalued side of the pendulum.
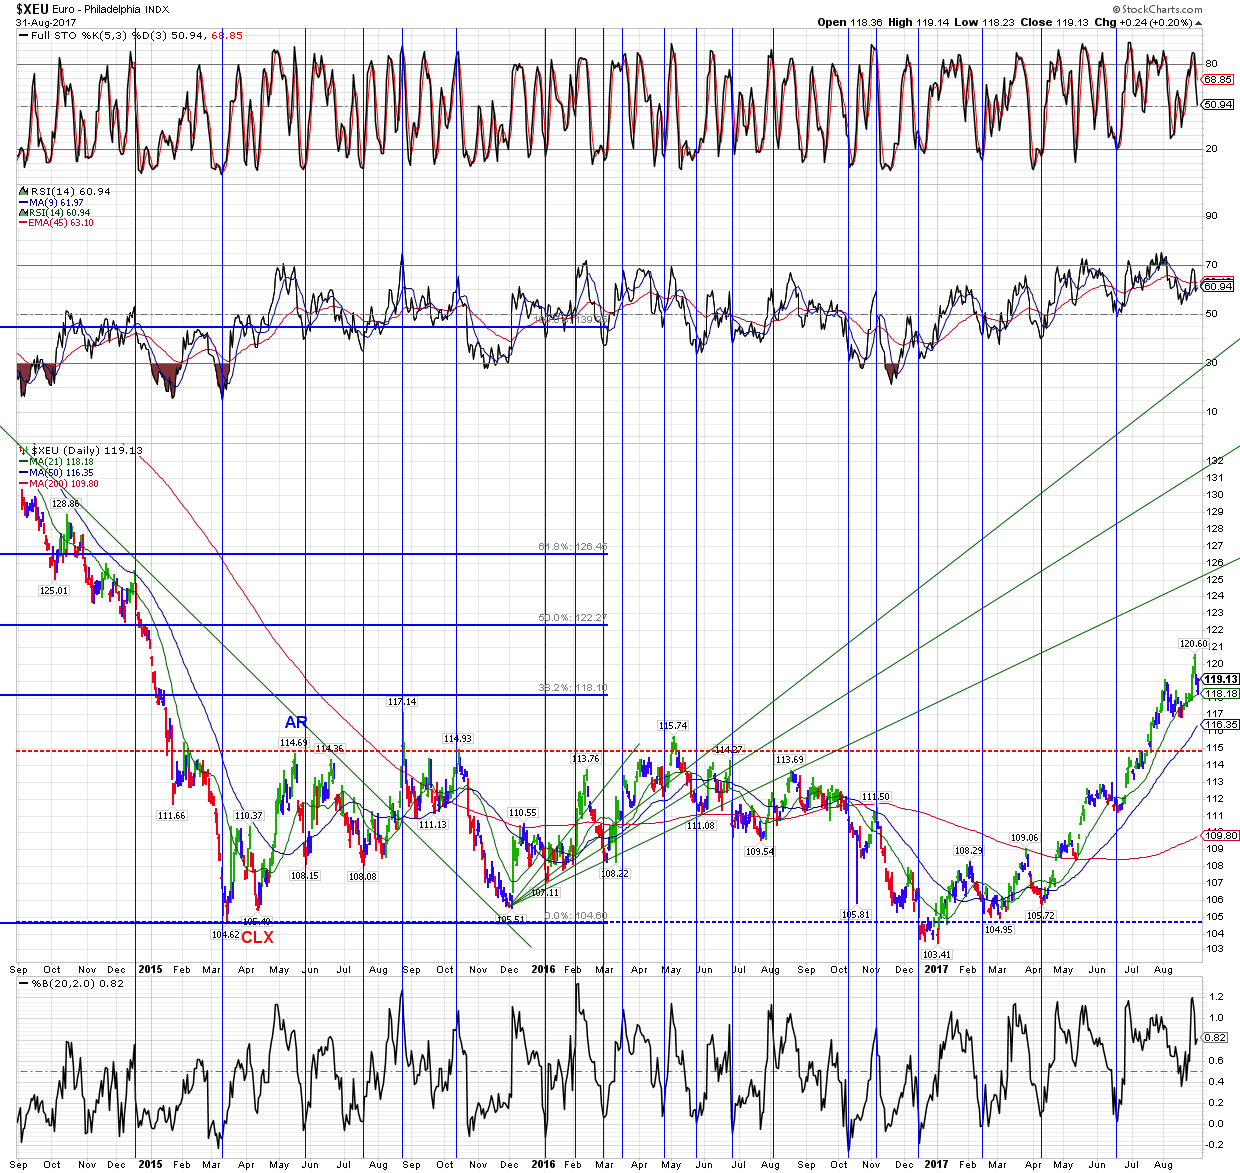
This is a 3 year EUR/USD WyKoff chart and I have made a number vertical lines when the Bollinger Band
width and t demonstrated how the market will top and bottom when the BB % get large or small enough.
I left all the vertical lines the same and was going to see if anyone could observe the difference in why some tops coincide exactly with price tops and some bottoms align perfectly with th BB% at low levels.
Some times they don't .... why would that be. since I am in a generous mode I will share with you an
extremely use technique.
what your will find is that when you use the BB % study.... It will be spot on in the corrective waves of a bull
or bear market but the primary trend of the market you can get your ultimate low reading on the BB% and because the primary trend has more momentum the ultimate low will come a little past the low on the BB%
which is logic since the power of momentum is with the primary trend.....In all honesty I don't think I have ever seen anyone who has laid it out and explained it as simply and concisely as I believe I have.
And as we all know there is no such thing as the 1 perfect indicator.... otherwise what would be the point
of the markets and people trading and investors looking for good entry and exit points. Rather, we are
looking for the balance of evidence, everything from Momentum and momentum divergences, time cycles,
Fibonacci price projections, more standard technical patterns and the measured move objectives derived from those pattern.... such as the break out of a rectangular range should move the distance of the range
and if the sideways consolidation has been longer then that increases the probability of a larger measured move.
often time we are not exactly sure if we are in a bull or bear market.. and there is ambiguity. This is one of
the nice clean ways of
1) helping you determine if you are in a bull or bear market. It is really useful for getting you in on pullbacks that are opposite of the primary trend of the market and it also put you on notice that you are going to most likely get overshoots in the direction of the primary trend.
2)Another really beneficial aspect of this technique is that when a market morphs from a bull to a bear, or
a bear to a bull, you will start to see how the BB% which was hitting the corrective lows at exactly the right
spot on the actual low cease to do that and it give you a head's up of a change in the primary trend.
I have some further research on this but way to tired to get into this morning.
just rounding out quickly here is a gold chart to ponder .... we have managed to make it above several cluster of fibonacci retracements and the RSI momentum is strong...... Silver has been sluggish and I am not happy about that....I much rather be in obvious situations such as copper, the EUR, the Yen , Gasoline, heating oil, and long the EUR/JPY cross rate..... those have been the market that have treated me well and they are not conflicted.

The 10 year note... it has these little fake out's down to 2.10% but then always closes at 2.12%... The .382 retracement is 2.13% and many people in the market really believe that it could hold that 2.12 2.13% area.

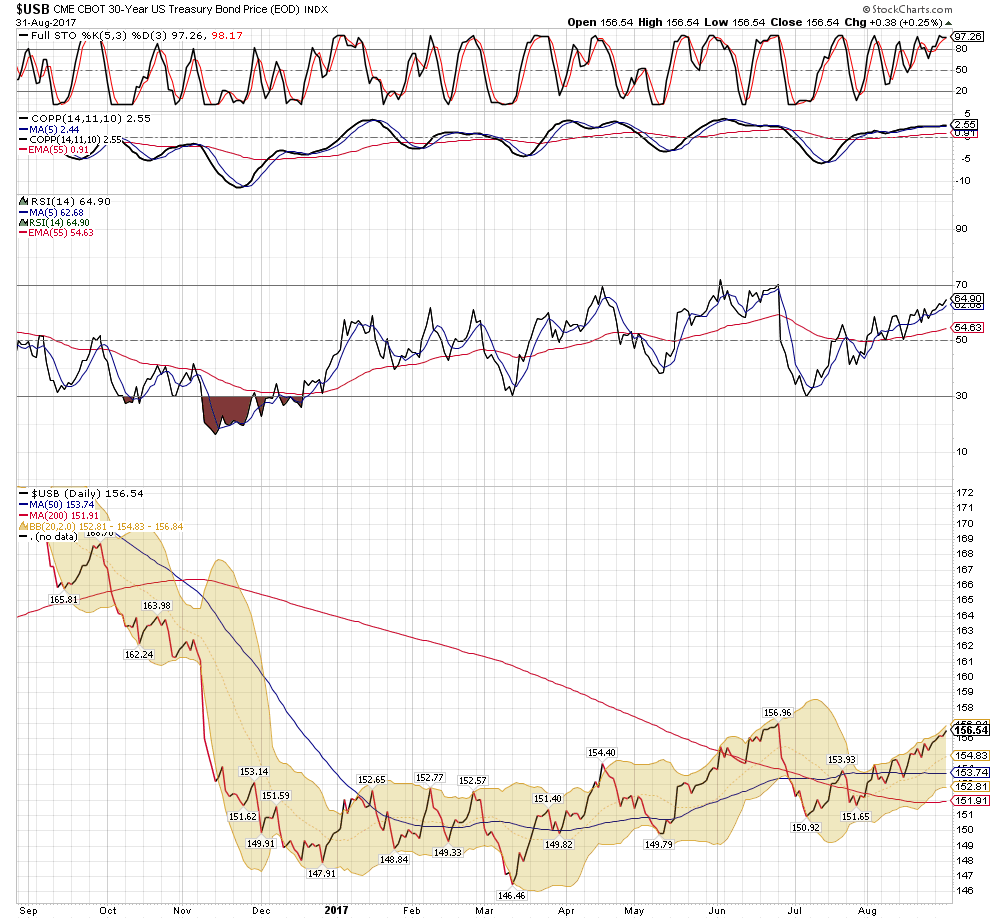
The 30 year bond --very important.... This is the price of the 30 year bond so the yield is the inverse.
since the middle of June the Impulse or Primary trend direction of the market appears to be down in price and up in yield... after the swift push down in price in Jun.. we have had this meandering upward advance in price....meaning that the yield has drift down lower in a corrective fashion...... And it's important to know that on the long end of the curve we have not gotten back up to the price highs of june , which means that the yield has not been able to get back to the June lows...... very important as the long end of the curve is very important and if we are going to be seeing significantly high yields............. It is important that the long end where there is so much hedging and also so many companies and governments have issued so much cheap debt that is long dated it;s 30, 40 and 50 year bonds....and again those are issued at the bottom of the long term yield cycle where the low yields will be going away.
enough for the moment.
JP |
|


