10-20-20: Inflation Remains Low Because “Velocity” Has Fallen Off the Table
by Gary Alexander
October 20, 2020
Last week (October 14-17) was the 46th annual New Orleans Investment Conference, and I’ve been a speaker, MC, and/or panel moderator there for the last 37 of them. This one was uniquely “virtual” over ZOOM. I hosted a political panel (with Tucker Carlson, Doug Casey, and Stephen Moore) from four corners of the nation (Florida, Maine, Washington, and Colorado) and I also listened to nearly all of the General Sessions from an array of other seasoned economic analysts. One of the biggest questions asked (and frequently answered) by speakers was, “With all this newly-printed money, where is the inflation?”
Several speakers, including Jim Rickards and Ronald-Peter Stoeferle, pointed out the rapid decline of monetary velocity – the speed at which money turns over. Rickards even disputed the term “stimulus,” with reference to bailout money, when that money is not spent but squirreled away. A stimulus check does not stimulate the economy if it is not spent. One example he used is that when a couple would go out to dinner and a show, they may have taken a taxi to both spots, spending and tipping along the way, but when they are forced to stay home, that means several hundred dollars are not spent. The taxi drivers, restaurant owners and employees, theater operators, musicians, and others are now totally out of work.
The standard equation for inflation in the Chicago “monetarist” school, championed by the late Milton Friedman, is MV = PQ, where M is the Money Supply, often denominated in M1 or M2, and V is the Velocity of that money in exchanges per year, with a normal turnover of 10 times for M1 or 2 for M2. The other side of the equation is “P,” referring to a price index for inflation, and “Q” stands for GDP.
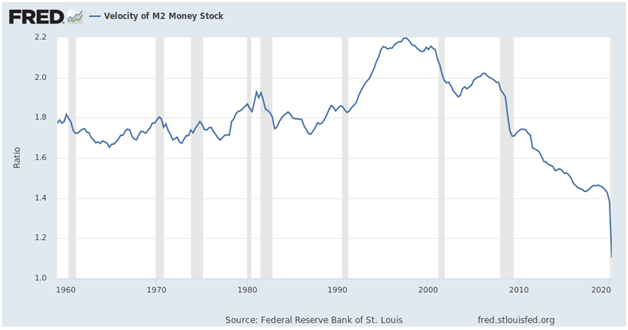
Milton Friedman said that rising money supply generally causes inflation because he assumed that monetary velocity was constant, but velocity is by no means constant. It started going down in 1998, then accelerated its decline after the 2008-09 monetary crisis and then fell off a table here in 2020 (see chart).
Graphs are for illustrative and discussion purposes only. Please read important disclosures at the end of this commentary.
If V is near zero, then Jim Rickards said, “$22 trillion (GDP) times zero (Velocity) is zero.” Velocity is by no means zero, but M2 velocity has fallen by 50% in the last two decades – from 2.2 down to 1.1.
The basic reason for this sharp decrease in velocity is the fear of deflation – the fear of the bad times to come, a job layoff, or falling prices in general – the belief that prices will be lower tomorrow than today.
People will tend to hold onto their cash if they believe prices will be lower next month, including the price of stocks. That’s why the Federal Reserve, and central bankers everywhere, fight deflation so fiercely. They need people to spend now, to goose the GDP this quarter, not next year, so the Fed has pulled out all stops in creating tools to encourage inflation in order to slay the greater devil of deflation.
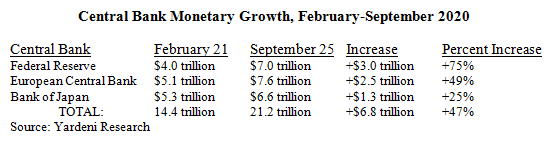
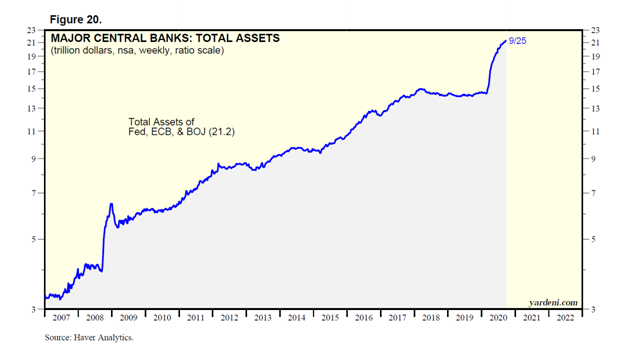
The three major central banks in the U.S., Japan, and Europe increased their balance sheets by 47% in seven months (February 21 to September 25), from $14.4 trillion to $21.2 trillion, a $6.8 trillion infusion. The dollar fell 10% from March through September because the Fed created money faster than the others:
Graphs are for illustrative and discussion purposes only. Please read important disclosures at the end of this commentary.
What it Will Take to Get All This Money CirculatingThere are several monetary measures. For money in circulation, including checking accounts (M1), the normal velocity is 10, whereas for the broader M2 – which includes M1 plus savings deposits, money market securities, and other near-cash deposits – the velocity was 2/year in 2008 and is barely one now.
MV=PQwhereM= money supply in the economy, mainly M1V= velocity of circulation.P=price level in the economyQ= output produced by the economyThe velocity of circulation “v” is defined as the average number of times a dollar bill circulates in the economy per year.Assume on average a dollar bill does ten transactions (buying and selling of goods and services) per year.Thus, velocity of circulation “v” in this case is 10. Here, a one-dollar bill does the equivalent of ten dollars’ worth of transactions.So, M x V=1×10=10 dollarsSource: Econmentor
With trillions of new dollars in circulation, there will be no meaningful inflation until those dollars start to circulate more. There is already some inflation in asset prices – in gold, stocks, and real estate – but not in everyday prices. In general, people are sitting on their savings and their stimulus checks, if they can.
Personal savings rates and government stimulus payments peaked in the second quarter, but both are still well above historical levels. Personal savings, at $2.4 trillion, are more than double their level at the start of 2020, and government social benefits at $4.1 trillion are about $1 trillion above previous annual levels.

Graphs are for illustrative and discussion purposes only. Please read important disclosures at the end of this commentary.
And now we’re talking about another $2 trillion (or so) “stimulus” package that will not stimulate the economy or generate inflation until the Covid-19 threat ends and the economy begins to open up without fear. At that time, when people spend with hope for the future, monetary velocity will return to normal and we may see a shocking rise in inflation rates across the board, in producer, consumer, and asset prices.
The latter category is the most important to investors. With trillions still on the sidelines, there is still great room for expansion in the current bull market in stocks. Like the Fed says, we can put up with 4% or 5% inflation – even a temporary spurt to 10% or more – if our assets are rising faster than 10%. The greater problem is putting the toothpaste back in the tube, curing double-digit inflation, as Fed Chairman Paul Volcker engineered in the early 1980s. That would involve raising interest rates and a new recession.
We’ll see the first official GDP figure in late October but for the time being the Atlanta Fed’s GDPNow forecast for third-quarter growth is 35.2% as of Friday, October 16, so maybe that’s fast enough growth. A 35% rebound will not get us back to pre-pandemic levels, but it’s a giant step in the right direction.
While Federal Reserve Chairman Jerome Powell is joining Congress and both Presidential candidates in claiming the economy will suffer without more fiscal aid, the monetarist St. Louis Fed President James Bullard told The Wall Street Journal last week that the economy is healthy enough that no more monetary stimulus may be needed. Maybe we should just open up the economy and let that be “stimulus” enough.
All content above represents the opinion of Gary Alexander of Navellier & Associates, Inc.
Please see important disclosures below. |


