 |
 | |
 |  |
| We've detected that you're using an ad content blocking browser plug-in or feature. Ads provide a critical source of revenue to the continued operation of Silicon Investor. We ask that you disable ad blocking while on Silicon Investor in the best interests of our community. If you are not using an ad blocker but are still receiving this message, make sure your browser's tracking protection is set to the 'standard' level. |

I will be posting daily and weekly charts with annotations here on a regular basis. I also post relevant news that may have an influence on which way the market moves. I do this because it helps me to think about what may happen next in the movements of the DJIA, so that I can play the trend correctly. Here is an example of what my annotated charts look like: I created this one on 11-05-08 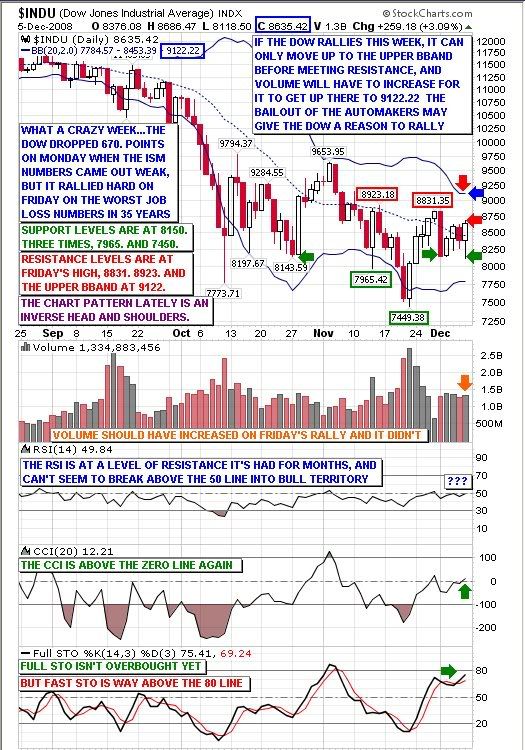 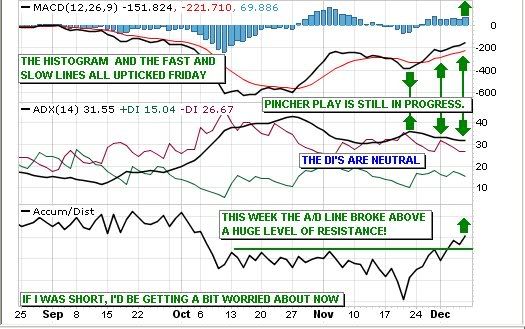 Here's the Inverse Head & Shoulders chart pattern (bullish) the Dow is showing on the daily chart: 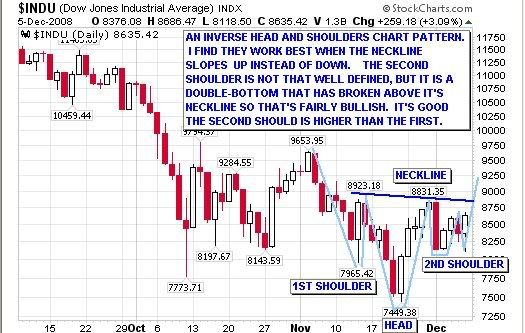 And here is a weekly chart for the week ending 12-05-08 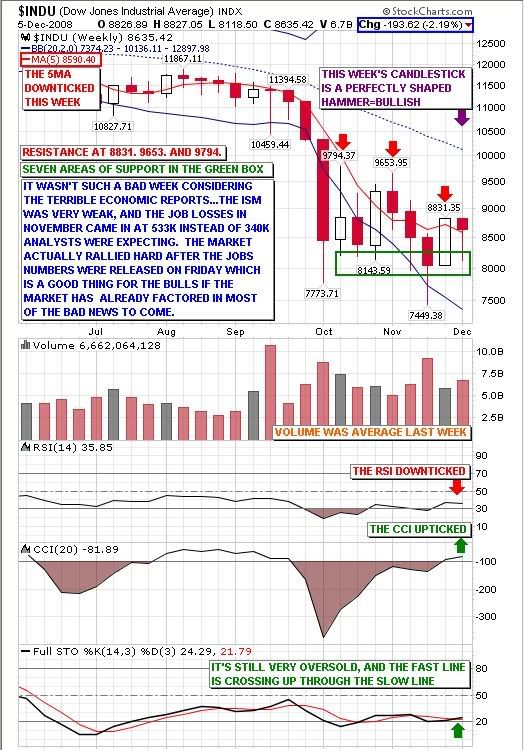 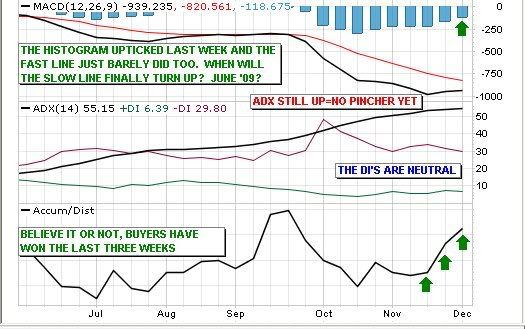 If you like to watch the Dow too, feel free to post your thoughts on which way it might go next. Happy Trading, zz  www.market-master.net | ||||||||||||||
|

| Home | Hot | SubjectMarks | PeopleMarks | Keepers | Settings |
| Terms Of Use | Contact Us | Copyright/IP Policy | Privacy Policy | About Us | FAQ | Advertise on SI |
| © 2026 Knight Sac Media. Data provided by Twelve Data, Alpha Vantage, and CityFALCON News |